💸Principles of Economics Unit 7 Review
7.5 Costs in the Long Run
7.5 Costs in the Long Run
Unit & Topic Study Guides
Welcome to Economics!
Choice in a World of Scarcity
Demand and Supply
Labor and Financial Markets
Elasticity
Consumer Choices
Production Costs and Industry Structure
Perfect Competition
Monopoly
Monopolistic Competition & Oligopoly
Monopoly and Antitrust Policy
Environmental Protection & Negative Externalities
Positive Externalities and Public Goods
Labor Markets and Income
Poverty and Economic Inequality
Information, Risk, and Insurance
Financial Markets
Public Economy
The Macroeconomic Perspective
Economic Growth
Unemployment
Inflation
International Trade & Capital Flows
Aggregate Demand & Supply Model
The Keynesian Perspective
The Neoclassical Perspective
Money and Banking
Monetary Policy & Banking Regulation
Exchange Rates & Global Capital Flows
Government Budgets & Fiscal Policy
Government Borrowing: Economic Impacts
Global Macroeconomic Policies
International Trade
Globalization and Protectionism
Long-Run Costs and Production
Long-run costs describe what happens when a firm can adjust every input, not just labor or materials, but also capital like factories and equipment. This matters because it explains how firms choose their size and why some industries naturally favor huge companies while others support small ones.
Long-Run Total Cost Calculation
In the short run, at least one input is fixed (usually capital). In the long run, all inputs are variable. That changes everything about how firms minimize costs.
Long-run total cost (LRTC) is the minimum cost of producing a given quantity when the firm is free to adjust every factor of production:
The key word here is minimum. For any output level, the firm picks the combination of inputs that costs the least. A firm producing 1,000 units might use lots of labor and little capital, or lots of capital and little labor. The long-run total cost reflects whichever mix is cheapest at current input prices.
This flexibility is what separates long-run analysis from short-run analysis. Firms aren't stuck with a factory that's too big or too small; they can choose the optimal production scale.
Economies of Scale Concepts
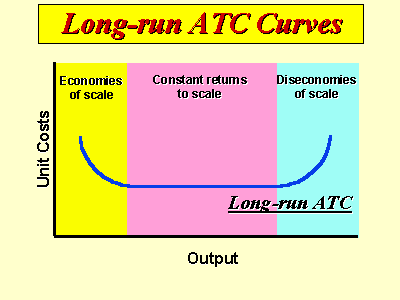
As firms expand output, their long-run average cost (LRAC) doesn't stay flat. It typically falls at first, then levels off, then rises. Each phase has a name:
- Economies of scale: LRAC decreases as output increases. This happens because larger firms can specialize labor (workers focus on one task), use capital more efficiently (running a machine at full capacity), and negotiate volume discounts on inputs.
- Diseconomies of scale: LRAC increases as output increases. At some point, a firm gets so large that coordination breaks down. Management layers multiply, communication slows, and logistics become expensive. These problems push average costs back up.
- Constant returns to scale: LRAC stays the same as output increases. Doubling all inputs exactly doubles output, so average cost per unit doesn't change.
Economies of scope are a related but distinct concept. They arise when producing multiple products together is cheaper than producing each one separately. For example, a dairy that makes both milk and cheese can share refrigeration and transportation costs across both product lines.

Long-Run vs. Short-Run Cost Curves
This is where the graphical relationship between the short run and long run comes together.
Each possible level of fixed capital gives the firm a different short-run average cost (SRAC) curve. A small factory has one SRAC curve; a medium factory has another; a large factory has yet another. Each SRAC curve is U-shaped because of diminishing marginal returns to the variable input (labor) in the short run.
The LRAC curve is the "envelope" of all these SRAC curves. Picture it this way:
- Draw several U-shaped SRAC curves, each representing a different plant size.
- The LRAC curve traces along the bottom of all those curves, touching (tangent to) each one at exactly one point.
- At each output level, the LRAC shows the lowest possible average cost when the firm is free to choose any plant size.
The LRAC curve is also typically U-shaped, but for a different reason than the SRAC curves. Its shape reflects economies of scale (the downward-sloping portion) and diseconomies of scale (the upward-sloping portion), not diminishing marginal returns.
Long-run marginal cost (LRMC) is the change in long-run total cost from producing one more unit. Just like in the short run, LRMC crosses LRAC at its minimum point.
Firm Production Adjustments Over Time
Firms respond to changing conditions differently depending on their time horizon.
In the short run, firms can only adjust variable inputs like labor and raw materials. They move along their current SRAC curve. If demand rises, they hire more workers and produce more, but they're stuck with their existing factory.
In the long run, firms can adjust everything, including capital. This means they can jump to an entirely different SRAC curve by building a bigger plant, adopting new technology, or downsizing. The goal is to land on the point of the LRAC curve that minimizes cost for their target output.
Three main factors drive these long-run adjustments:
- Technological change can shift the entire LRAC curve downward. Investing in automation, for instance, might reduce costs at every output level.
- Input price changes alter which combination of inputs is cheapest. If wages rise relative to the cost of machinery, firms substitute toward more capital.
- Expected future demand shapes how firms plan capacity. A firm expecting sustained growth will invest in a larger plant size now rather than running a small plant at overcapacity.
Production and Cost Analysis
A few additional tools tie long-run cost analysis together:
- Isoquants are curves showing all combinations of inputs (say, labor and capital) that produce the same quantity of output. They work like indifference curves, but for production.
- Isocost lines show all input combinations a firm can afford for a given total cost. The slope of an isocost line reflects the relative prices of the two inputs.
- The firm minimizes cost where an isoquant is tangent to an isocost line. At that point, the firm gets the most output for its money.
- The expansion path connects these tangency points across different output levels. It traces the least-cost input mix as the firm scales up, showing how the optimal ratio of labor to capital changes with output.
- Minimum efficient scale (MES) is the smallest output level at which LRAC reaches its minimum. Industries with a high MES (like automobile manufacturing) tend to have fewer, larger firms. Industries with a low MES (like restaurants) can support many small competitors.