♾️AP Calculus AB/BC Unit 1 Review
1.4 Estimating Limit Values from Tables
1.4 Estimating Limit Values from Tables
Unit & Topic Study Guides
Unit 1 – Limits and Continuity
Unit 2 – Fundamentals of Differentiation
Unit 3 – Composite, Implicit, and Inverse Functions
Unit 4 – Contextual Applications of Differentiation
Unit 5 – Analytical Applications of Differentiation
Unit 6 – Integration and Accumulation of Change
Unit 7 – Differential Equations
Unit 8 – Applications of Integration
Unit 9 – Parametric Equations, Polar Coordinates, and Vector–Valued Functions (BC Only)
Unit 10 – Infinite Sequences and Series (BC Only)
AP Calculus AB/BC Exams
Mathematical Practices
Exam Skills
Frequently Asked Questions
Estimating a limit from a table means picking x-values that get closer and closer to a target number from both sides, then watching where the function outputs head. If the outputs from the left and the outputs from the right approach the same number, that shared value is your estimate for the limit. For AP Calculus, compare both sides of the table before deciding whether a two-sided limit exists.
Why This Matters for the AP Calculus Exam
AP Calculus expects you to estimate or evaluate limits presented in different forms, including numerically in a table. Tables come up when direct substitution gives something undefined, like a 0/0 form, or when you only have data points instead of a clean equation. Being able to read a table and decide what value the outputs approach connects to a core skill in this course: translating between numerical, graphical, analytical, and verbal representations of the same idea.
This skill also sets up later work. The same "approach a value from both sides" thinking shows up in derivatives, where you study what a difference quotient approaches, and in deciding whether a function is continuous at a point.

Key Takeaways
- A limit describes the value approaches as gets near a target number , not necessarily the value at .
- To estimate from a table, choose x-values that creep toward from both the left side and the right side.
- The left-side outputs and right-side outputs must approach the same number for the two-sided limit to exist.
- A table is most useful when direct substitution gives an undefined or indeterminate result like .
- If the two sides head toward different values or grow without bound, the two-sided limit does not exist at that point.
- Your table answer is an estimate, so state the value the outputs are clearly approaching.
Concept of a Limit Recap
A limit is the value approaches as gets near a target number . It is usually written like this:
The arrow means is approaching the target number , and is the value the function heads toward as gets close to . A table is one tool for finding that value.
One-Sided Limits
A one-sided limit looks at approaching the target number from only one side of the number line. The left side uses numbers less than , and the right side uses numbers greater than .
The side is shown with a small sign at the top corner of the target value. A plus sign means approaching from the right, and a minus sign means approaching from the left.
For the regular two-sided limit to exist, the left-side limit and the right-side limit have to approach the same value.
Using a Table to Estimate Limits
Sometimes direct substitution does not work, because plugging the target number straight into the function gives an undefined result. Here is an example:
If you plug in 0, you get , which is undefined. That does not mean the limit fails to exist, it just means substitution alone cannot tell you the value.
To estimate the limit, substitute x-values close to the target number from both the left and right sides. As you do this, the outputs from both sides should head toward a single value. That value is your estimate for the limit.
A table keeps this organized. Put x-values approaching in one row and the matching function outputs in the next row.

Reading this table:
- As the x-values approach 0 from the right side, the outputs get closer to 2.
- As the x-values approach 0 from the left side, the outputs also get closer to 2, even though the function never actually equals 2 at .
Since both sides head toward the same value, you can estimate that the limit as approaches 0 is 2.
When we say x-values near the target value , we mean numbers in close proximity to on both sides. For example, if , then values near 1 include 0.9, 0.99, and 0.999 from the left, and 1.001, 1.01, and 1.1 from the right.
For this method to work, the left side and the right side relative to the target number must approach the same output value.
If the left and right sides do not approach the same value, the two-sided limit does not exist. One reason this can happen is a vertical asymptote at the target number, where outputs grow without bound. Those cases come up later in the unit.
Practice: Estimating a Limit from a Table
Start by building a table of x-values that are slightly less than and slightly greater than 4.
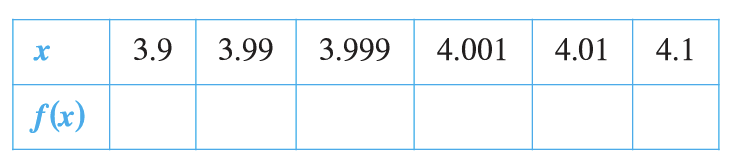
Next, plug each x-value into the function to find the output approached from each side.
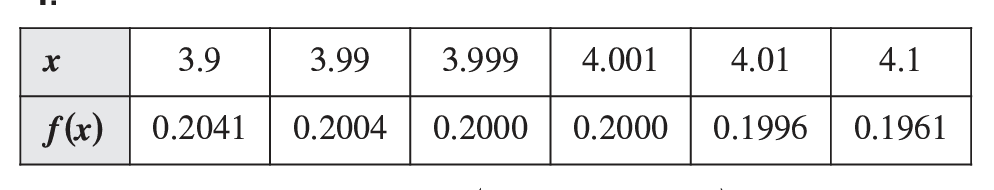
The outputs from both the left and right of 4 head toward 0.2, so you can estimate the limit as approaches 4 is 0.2.
The main move in these problems is choosing x-values near the target number and watching where the outputs settle.
How to Use This on the AP Calculus Exam
MCQ
- You may be handed a table of and values and asked what the limit is at a specific point. Compare the left-side trend and right-side trend, and pick the shared value.
- Watch for tables where the two sides head toward different numbers. The correct answer there is that the limit does not exist.
- A function value listed at the target point can differ from the limit. Trust the trend of nearby outputs, not the single value at .
Problem Solving
- When direct substitution gives , a table can reveal the value the outputs approach.
- Use x-values that get progressively closer to , such as 0.9, 0.99, 0.999, so the trend is clear.
- Report the value the outputs are approaching, and use correct limit notation when you write your answer. Clear notation makes your reasoning easy to follow.
Common Trap
- Outputs that keep growing larger and larger (without settling) signal that the limit does not exist at that point, often because of a vertical asymptote.
Common Misconceptions
- The limit is not the same as the function value at . The function can be undefined at while the limit still exists.
- A table gives an estimate, not a guaranteed exact answer. If outputs are rounded, the value they approach may be slightly off from what the table shows.
- A 0/0 result from substitution does not mean the limit does not exist. It means you need another approach, such as a table.
- Both one-sided trends must match for the two-sided limit to exist. Looking at only one side can mislead you.
- Picking x-values that are too far from can hide the real trend. Use values that genuinely close in on the target.
Related AP Calculus Guides
- 1.2 Defining Limits and Using Limit Notation
- 1.1 Introducing Calculus: Can Change Occur at An Instant?
- 1.6 Determining Limits Using Algebraic Manipulation
- 1.3 Estimating Limit Values from Graphs
- 1.5 Determining Limits Using Algebraic Properties of Limits
- 1.8 Determining Limits Using the Squeeze Theorem
Vocabulary
The following words are mentioned explicitly in the AP® course framework for this topic.Term | Definition |
|---|---|
function | A mathematical relationship that assigns exactly one output value to each input value of an independent variable. |
limit | The value that a function approaches as the input approaches some value, which may or may not equal the function's value at that point. |
Frequently Asked Questions
How do you estimate a limit from a table?
Use x-values that get close to the target from the left and from the right, then compare the function outputs. If both sides approach the same value, that value estimates the two-sided limit.
What does a table tell you about a one-sided limit?
A table estimates a one-sided limit by showing outputs as x approaches the target from only one side. Values less than the target show the left-hand limit, and values greater than the target show the right-hand limit.
When does a two-sided limit exist from a table?
A two-sided limit exists when the outputs from the left and the outputs from the right approach the same number as x gets close to the target.
When does a limit not exist from a table?
A limit does not exist if the left and right sides approach different values, if the outputs grow without bound, or if the table shows no single value being approached.
Does the function value at the target equal the limit?
Not necessarily. A limit depends on nearby values, not the value at the target point. The function can be undefined at the target while the limit still exists.
Why use a table when substitution gives 0 over 0?
A 0 over 0 result means substitution is indeterminate, not that the limit fails. A table can reveal what value the outputs approach from both sides.