♾️AP Calculus AB/BC Unit 1 Review
1.11 Defining Continuity at a Point
1.11 Defining Continuity at a Point
Unit & Topic Study Guides
Unit 1 – Limits and Continuity
Unit 2 – Fundamentals of Differentiation
Unit 3 – Composite, Implicit, and Inverse Functions
Unit 4 – Contextual Applications of Differentiation
Unit 5 – Analytical Applications of Differentiation
Unit 6 – Integration and Accumulation of Change
Unit 7 – Differential Equations
Unit 8 – Applications of Integration
Unit 9 – Parametric Equations, Polar Coordinates, and Vector–Valued Functions (BC Only)
Unit 10 – Infinite Sequences and Series (BC Only)
AP Calculus AB/BC Exams
Mathematical Practices
Exam Skills
Frequently Asked Questions
TLDR
A function is continuous at a point x = c when three things are all true: f(c) exists, the limit as x approaches c exists, and that limit equals f(c). If any one of these fails, the function is discontinuous at c, and on the AP Calculus exam you need to name which condition breaks down.

Why This Matters for the AP Calculus Exam
Continuity at a point is the formal rule that ties limits and function values together, and it shows up across AP Calculus questions. You will often need to justify whether a function is continuous, not just state yes or no. That means checking each condition and explaining your reasoning, which is the same justification skill the exam rewards in both multiple-choice and free-response work.
This definition also sets up later topics. Continuity over an interval, removing discontinuities, and the Intermediate Value Theorem all build on the three-part test you learn here. Differentiability in Unit 2 also depends on continuity, so getting comfortable now pays off later.
Key Takeaways
- A function f is continuous at x = c only if f(c) exists, exists, and .
- All three conditions must hold. If even one fails, f is not continuous at c.
- For the limit to exist, the left-hand and right-hand limits must be equal.
- Polynomial, rational, power, exponential, logarithmic, and trigonometric functions are continuous at every point in their domains.
- When you justify continuity, write out each condition you checked before stating your conclusion.
- A removable discontinuity (hole) happens when the limit exists but does not equal f(c), or f(c) is undefined.
What Is Continuity?
Continuity means a function behaves smoothly with no sudden jumps, holes, or breaks. Think of drawing the graph near a point without lifting your pen. The function value and the value the graph approaches have to match up.
On the AP Calculus exam, you usually need to justify why a function is or is not continuous at a point. Stating the answer is not enough. You have to connect it back to the definition.
The Three Conditions for Continuity at a Point
A function is continuous at a point in its domain when all three of these are true:
- is defined (the function actually has a value at ).
- exists (the left-hand and right-hand limits agree).
- (the limit equals the function value).
If all three hold, f is continuous at c. If any one fails, f is discontinuous at c.
A useful way to keep these straight: condition 1 is about the function value, condition 2 is about the limit, and condition 3 ties them together. You really need all three, because a function can have a value and a limit at the same point that still do not match (that is a removable discontinuity).
Checking Continuity From a Graph
A graph makes continuity easy to spot. Here is how to read one near a point of interest:
- Find the point you care about.
- Trace the graph approaching from the left and from the right. The two sides should head toward the same height. If they do, the limit exists.
- Check that the plotted point at sits exactly where those two sides meet. If there is an open circle, a filled dot off to the side, or a vertical asymptote, something fails.
If the graph connects smoothly from both sides and the point is filled in at that meeting height, the function is continuous there. A gap, jump, hole, or asymptote means it is discontinuous.
Example: reading graphs for continuity
Look at these four graphs:
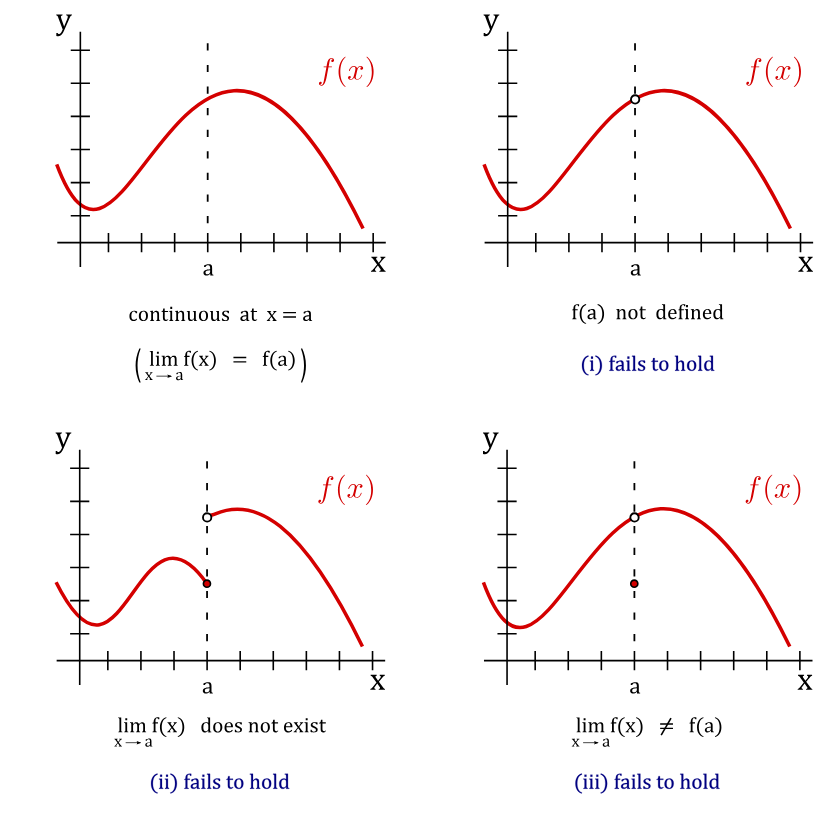
Only the top left graph is continuous at the point of interest. The other three each have a break, jump, or hole, so a condition fails at that point. When you write your reasoning, name exactly which condition fails, not just "it looks broken."
How to Use This on the AP Calculus Exam
Free Response
When a free-response question asks you to justify continuity, list the conditions and check each one in order. For example:
- State that exists and give its value.
- State that exists (showing the one-sided limits match if needed).
- State that the limit equals .
Then write your conclusion. Bulleting these out keeps your work organized and makes your reasoning clear, which matters for showing complete justification.
MCQ
Multiple-choice questions often give you a function value and a limit that disagree, or a point where the function is undefined. Quickly test all three conditions. If the limit exists but the function is undefined or has a different value there, that is a removable discontinuity.
Common Trap
Do not stop after checking just one condition. A function can have a defined value at c and still be discontinuous if the limit does not exist or does not match. Always confirm all three.
Worked Examples
Example 1
Is continuous at ? Justify using the definition.
- , so exists.
- , so the limit exists.
- The limit equals since both are 11.
All three conditions hold, so is continuous at . (This is a polynomial, which is continuous everywhere in its domain.)
Example 2
Are and continuous at ?
For :
- , so exists.
- , so the limit exists.
- The limit equals .
For :
- , so exists.
- , so the limit exists.
- The limit equals .
Both functions are continuous at .
Example 3
Are and continuous at ?
For :
- is undefined, so the first condition already fails.
Since must exist and does not, is not continuous at (there is a vertical asymptote there).
For :
- , so exists.
- , so the limit exists.
- The limit equals .
So is continuous at , but is not.
Common Misconceptions
- "If f(c) is defined, the function is continuous there." Not true. The limit still has to exist and match f(c). A hole or jump can exist even when the point is defined.
- "If the limit exists, the function is continuous." The limit can exist while f(c) is undefined or set to a different value. That is exactly a removable discontinuity.
- "Continuous and differentiable mean the same thing." They are connected but not identical. Continuity is required for differentiability, but a function can be continuous at a point and still not be differentiable there (you will see this in Unit 2).
- "A vertical asymptote is just a missing point I can fill in." An infinite discontinuity cannot be removed by redefining one value, because the limit does not exist as a real number there.
- "Showing the answer is enough." On justification questions you need to state that each condition is met before drawing your conclusion. Skipping the setup leaves out the reasoning the question is asking for.
Related AP Calculus Guides
- 1.2 Defining Limits and Using Limit Notation
- 1.1 Introducing Calculus: Can Change Occur at An Instant?
- 1.6 Determining Limits Using Algebraic Manipulation
- 1.3 Estimating Limit Values from Graphs
- 1.5 Determining Limits Using Algebraic Properties of Limits
- 1.8 Determining Limits Using the Squeeze Theorem
Vocabulary
The following words are mentioned explicitly in the AP® course framework for this topic.Term | Definition |
|---|---|
continuity | A property of a function at a point where the function is defined, the limit exists, and the limit equals the function value at that point. |
function | A mathematical relationship that assigns exactly one output value to each input value of an independent variable. |
limit | The value that a function approaches as the input approaches some value, which may or may not equal the function's value at that point. |
Frequently Asked Questions
What does continuity at a point mean?
Continuity at a point means the function value and the limit at that point match. Informally, the graph has no hole, jump, or break at x = c.
What are the three conditions for continuity?
A function f is continuous at x = c if f(c) exists, lim x approaches c of f(x) exists, and that limit equals f(c). If any one of those conditions fails, the function is not continuous at c.
How do I check continuity from a graph?
Check that the graph approaches the same y-value from the left and right, then check that the filled point at x = c is at that same y-value. Open circles, jumps, and vertical asymptotes signal discontinuity.
What is a removable discontinuity?
A removable discontinuity happens when the limit exists but the function value is missing or does not equal the limit. On a graph, this often appears as a hole or a filled point at the wrong height.
What is the difference between continuity and differentiability?
Continuity means the function has no break at a point. Differentiability means the derivative exists there. Differentiability implies continuity, but a function can be continuous and still not differentiable at a corner, cusp, or vertical tangent.
How do I justify continuity on the AP Calculus exam?
Write the three conditions in context: give f(c), show the limit exists, and state that the limit equals f(c). Then conclude that the function is continuous at that point.