♾️AP Calculus AB/BC Unit 6 Review
6.5 Interpreting the Behavior of Accumulation Functions Involving Area
6.5 Interpreting the Behavior of Accumulation Functions Involving Area
Unit & Topic Study Guides
Unit 1 – Limits and Continuity
Unit 2 – Fundamentals of Differentiation
Unit 3 – Composite, Implicit, and Inverse Functions
Unit 4 – Contextual Applications of Differentiation
Unit 5 – Analytical Applications of Differentiation
Unit 6 – Integration and Accumulation of Change
Unit 7 – Differential Equations
Unit 8 – Applications of Integration
Unit 9 – Parametric Equations, Polar Coordinates, and Vector–Valued Functions (BC Only)
Unit 10 – Infinite Sequences and Series (BC Only)
AP Calculus AB/BC Exams
Mathematical Practices
Exam Skills
Frequently Asked Questions
An accumulation function stores the net signed area under from to . Its behavior comes from the graph of : increases where is positive, decreases where is negative, and changes concavity where changes from increasing to decreasing or back. For AP Calculus, read the integrand graph before describing the accumulation function.
Why This Matters for the AP Calculus Exam
This topic builds the skill of reading a function defined by an integral without ever finding a formula for it. On both multiple-choice and free-response questions, you are often handed the graph of (frequently labeled as a derivative) and asked about the function it defines. You need to connect the sign of to whether is increasing or decreasing, the zeros of to the extrema of , and the slope of to the concavity of . Free-response questions in AP Calculus regularly use a graph made of semicircles and line segments so you can find exact areas with geometry, then interpret what those areas mean.

Key Takeaways
- measures net signed area under , so area below the x-axis counts as negative.
- By the Fundamental Theorem of Calculus, and .
- increases where is positive and decreases where is negative; extrema of happen where changes sign.
- is concave up where is increasing and concave down where is decreasing; inflection points of occur where changes from increasing to decreasing or back.
- always, since the area from to is zero.
- When you only have a graph of , use geometry (triangles, rectangles, semicircles) to compute exact accumulated area.
The Fundamental Theorem of Calculus, Briefly
This is a quick summary. For the full setup, see the 6.4 guide.
The Fundamental Theorem of Calculus connects an accumulation function to an antiderivative. If
then
The first equation says is the accumulated area under between the fixed lower bound and the variable upper bound . Here is a constant and varies.
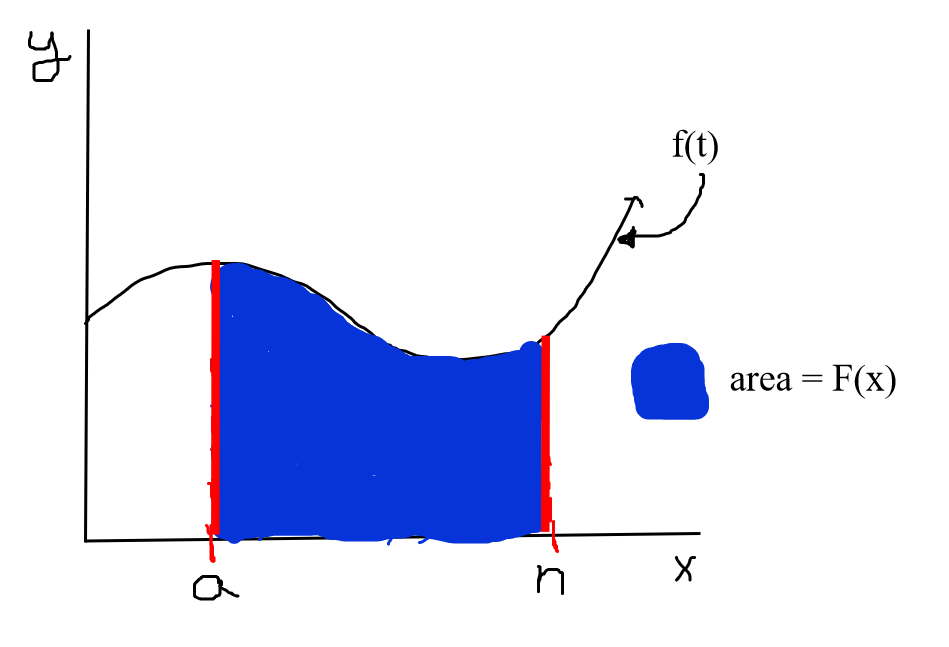
The second equation says the derivative of is . Equivalently, is an antiderivative of . Putting these together: the accumulated area under equals the value of at that upper bound.
Reading the Behavior of g from f
An integrally defined function has the same kinds of features as any other function: intervals of increase and decrease, extrema, concavity, and inflection points. Many AP questions hand you a graph or formula for and ask you to describe .
Quick Reference Chart
| If g(x) is… | then g'(x) | and g''(x) |
|---|---|---|
| Increasing | + | --- |
| Decreasing | - | --- |
| Relative Maximum | 0 and changes from + to - | is - |
| Relative Minimum | 0 and changes from - to + | is + |
| Concave Up | --- | is + |
| Concave Down | --- | is - |
| Inflection Point | --- | Changes Sign |
Increasing and decreasing come from the first derivative; concavity comes from the second derivative. A relative minimum or maximum cannot also be an inflection point.
The key move with accumulation problems is that you are working backward. Instead of differentiating the given graph or formula, treat it as the already-found derivative of your target function. For example, if
then is , so use it to find critical points or differentiate it again for concavity.
How to Use This on the AP Calculus Exam
Almost all questions on this topic come as a graph, a table, or an equation, and all three show up regularly. The graph type is the most common, so that is the focus here.
Free Response
Graph questions usually define and give you the graph of . The graph you see is not your target function. It is the derivative of your target function. Here is an official College Board free-response question from the 2022 exam.
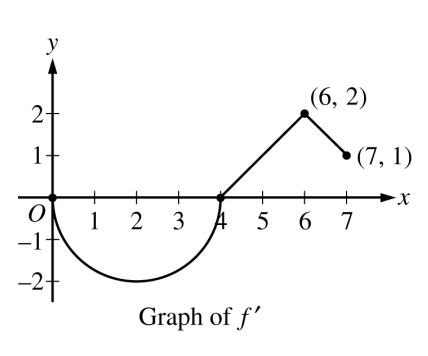
Let be a differentiable function with . On the interval , the graph of , the derivative of , consists of a semicircle and two line segments, as shown in the figure above.
(a) Find and .
(b) Find the x-coordinates of all points of inflection on the graph of for . Justify your answer.
(c) Let be the function defined by . On what intervals, if any, is decreasing for ? Show the analysis that leads to your answer.
(d) For the function defined in part (c), find the absolute minimum value on the interval . Justify your answer.
Part (a)
Part (a) asks for and . Since the graph is , the original function satisfies
By the Fundamental Theorem of Calculus, the integral of equals the net signed area between the curve and the x-axis, which is the change in over those bounds. Set up two equations.
The first is
which rearranges to
💡 Watch your bounds. The lower bound is where you start and the upper bound is where you end. Arrange every setup as f(low bound) + (integral from low to high) = f(high bound).
Here, , and is the area under from to , which is the semicircle region. Its area is
Since this region is below the x-axis, the net signed area is negative. So
For , set up
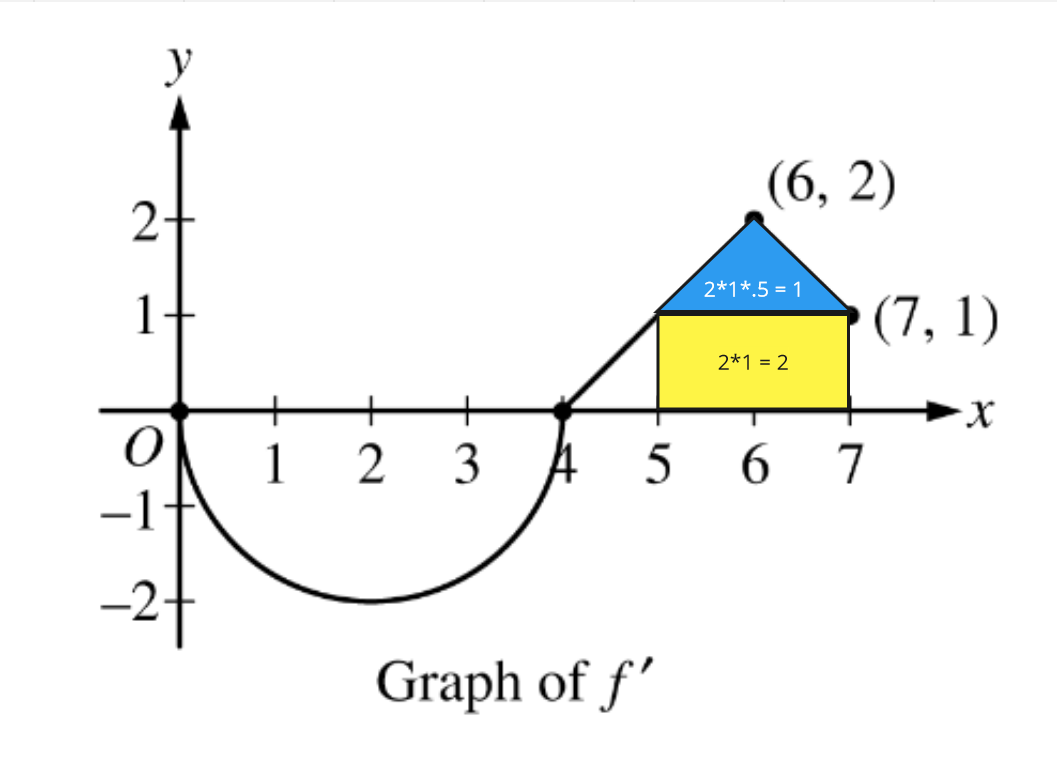
The region from to lies under the first line segment, which has slope using the points and . At , the height is , so the triangle has base and height , giving area . Then
Write down your integral setups and clearly label your final answers as and .
Part (b)
This asks for the x-coordinates of points of inflection of . Since you are given , the inflection points of occur where the slope of changes sign (that is, where changes sign). On the graph, this happens at , where the slope of changes from negative to positive, and at , where it changes from positive to negative.
💡 There is a corner in at , but it is not an inflection point of . The slope of goes from very steep and positive to a smaller positive constant without changing sign, so does not change sign there.
Part (c)
The new function is
so
A function decreases when its derivative is negative, so is decreasing when
or
From the graph, this holds on .
Part (d)
This asks for the absolute minimum of . Since , a critical point happens where , which occurs at . The candidates are the endpoints and plus the critical point .
| x | f(x) | g(x) = f(x) - x |
|---|---|---|
| 0 | 3 + 2pi | 3 + 2pi |
| 5 | 3.5 | 3.5 - 5 = -1.5 |
| 7 | 7.5 | 6.5 - 7 = -0.5 |
The values and come from part (a). The value comes from , using geometry to find the area.
So the absolute minimum of is , which occurs at .
Problem Solving Tips
- 💭 Anchor the relationship. If , then and . Write this somewhere on your paper.
- 📈 Use the graph. Mark zeros, maxima, and minima of , then relate each back to a feature of .
- 🧠 Check every candidate. Evaluate at critical points where changes sign, and don't forget the endpoints.
- ✅ Track which function you need. It is easy to mix up , , and . Confirm you are analyzing the right derivative before you answer.
Common Misconceptions
- The given graph is the function itself. When a problem gives you the graph of and defines , the graph is , not . Read features of off of .
- Area is always positive. Accumulation is net signed area. Regions below the x-axis subtract from the total, so a semicircle below the axis contributes a negative value.
- Extrema of g come from zeros of f', not f. The extrema of happen where (which equals ) changes sign, not where has a maximum or minimum.
- Every corner is an inflection point. A corner or sharp change in only signals an inflection point of if the slope of actually changes sign there.
- Forgetting endpoints in an absolute extremum search. On a closed interval, compare at the endpoints as well as at the interior critical points.
- Mixing up g, g', and g''. Increasing and decreasing of come from the sign of ; concavity of comes from whether is rising or falling.
Related AP Calculus Guides
- Unit 6 Overview: Integration and Accumulation of Change
- 6.11 Integrating Using Integration by Parts
- 6.1 Integration and Accumulation of Change
- 6.12 Integrating Using Linear Partial Fractions
- 6.3 Riemann Sums, Summation Notation, and Definite Integral Notation
- 6.4 The Fundamental Theorem of Calculus and Accumulation Functions
Vocabulary
The following words are mentioned explicitly in the AP® course framework for this topic.Term | Definition |
|---|---|
accumulation function | Functions that represent the accumulated total of a quantity over an interval, typically defined as g(x) = ∫[a to x] f(t) dt. |
definite integral | The integral of a function over a specific interval [a, b], representing the net signed area between the curve and the x-axis. |
Frequently Asked Questions
How do accumulation functions involving area behave?
An accumulation function such as g(x) = integral from a to x of f(t) dt stores net signed area under f. Because g prime equals f, the sign and behavior of f tell you where g increases, decreases, has extrema, and changes concavity.
How do you tell where an accumulation function is increasing or decreasing?
If g(x) = integral from a to x of f(t) dt, then g prime equals f. So g increases where f is positive and decreases where f is negative.
Where do extrema occur for an accumulation function?
Extrema of g occur where g prime changes sign. Since g prime equals f, look for x-values where f crosses the x-axis and changes from positive to negative or negative to positive.
How do you determine concavity of an accumulation function?
Concavity of g comes from g double prime. Since g prime equals f, g double prime equals f prime. That means g is concave up where f is increasing and concave down where f is decreasing.
Why does signed area matter for accumulation functions?
Accumulation functions measure net signed area. Area above the x-axis adds to the total, while area below the x-axis subtracts from the total, so you must track sign when evaluating g values.
How is Topic 6.5 tested on the AP Calculus exam?
AP Calculus questions often give a graph, table, or formula for f and define g as an integral of f. You may need to find g values using area, identify increasing/decreasing intervals, determine extrema, or explain concavity and inflection points.