Now that you know how to take basic derivatives, it’s time to take it up a notch and learn how to actually apply differentiation to different problems. Remember how AP Calculus is all about memorizing formulas? This still stands with these problems - the College Board will generally give you different variations of the same problem, so as long as you know how to solve these, you’ll be okay! 🙆♂️
Graphical Analysis
Graphical analysis is a MAJOR AP TOPIC along with Calculus BC Integrals and Sequences and Series. You should expect at least one FRQ to be on Graphical Analysis along with several multiple-choice questions. 📊 This unit makes up 15-18% of the AB exam and 8-11% of the BC exam.
For the following theorems and tests, you need to know the conditions for each test as well as how to perform them.

5.1 Using the Mean Value Theorem
The Mean Value Theorem (MVT) is explained below.
.png?alt=media&token=16e334ff-738a-4784-86b8-4fc8f4d05062)
Essentially, if the function is continuous on a closed interval (including the endpoints) and differentiable on the open interval (not necessarily including the endpoints), then there is a point within the interval where the slope of the tangent line (derivative) is equal to the average rate of change (secant line) between the endpoints of the interval.
It is important to note that the MVT applies only to functions that are both continuous and differentiable. Also, it only guarantees the existence of at least one point c satisfying the condition, but not that there is only one such point.
For example, here is a graph demonstrating the MVT with two points that satisfy the conditions.

5.2 Extreme Value Theorem, Global vs. Local Extrema, and Critical Points
The Extreme Value Theorem (EVT) states that if a function is continuous on a closed interval [a, b], then the function must attain both a maximum and a minimum value on that interval.
.png?alt=media&token=a576e5cf-d48a-4b07-bad5-b5dbe0981dff)
The EVT guarantees the existence of at least one global maximum and one global minimum but does not say anything about the number of local extrema or the number of critical points. There could be more than one minimum and maximum.
Global/absolute extrema refer to the highest and lowest points of a function over the entire domain of the function, while local extrema refer to the highest and lowest points of a function over a specific subinterval of the domain. 📈
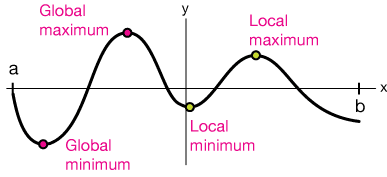
A critical point of a function is a value in the domain of the function such that either or does not exist. Critical points are important in finding the extrema of a function, as local extrema will always occur at critical points (where the derivative is either 0 or undefined). In the graph above, the slope of the tangent line at each of the minima and maxima is zero, meaning the tangent line is horizontal.
5.3 Determining Intervals on Which a Function is Increasing or Decreasing
The first derivative test is a method used to determine whether a function is increasing or decreasing on a specific interval by analyzing the sign (positive or negative) of its first derivative.
To use the first derivative test, we need to find the first derivative of the function. Then, we can analyze its sign at different points in the interval to determine whether the function is increasing or decreasing. If the first derivative is positive at a point, then the function is increasing at that point. If the first derivative is negative at a point, then the function is decreasing at that point.
The first derivative test applies only to differentiable functions and cannot be used on a function that is not differentiable.
5.4 Using the First Derivative Test to Determine Relative (Local) Extrema
Additionally, we can also use the first derivative test to find the critical points of a function, which are the points where the derivative is either 0 or does not exist. These are the points where the function changes from increasing to decreasing or vice versa.
.png?alt=media&token=ec7ef2b3-7322-4e30-889b-4d762f64a72d)
The steps to find the local maxima and minima of a function using the first derivative test are as follows:
- Find the critical points of the function by solving the equation or by finding the points where is undefined.
- Test the sign of the first derivative at points slightly to the left and right of each critical point.
- If the first derivative is positive on one side of the critical point and negative on the other side, then the critical point is a local minimum.
- If the first derivative is negative on one side of the critical point and positive on the other side, then the critical point is a local maximum.
- If the first derivative is of the same sign on both sides of a critical point, then the critical point is not a local extremum.
5.5 Using the Candidates Test to Determine Absolute (Global) Extrema
The Candidates Test is a method used to determine the absolute (global) extrema of a function by analyzing the function's behavior at specific points known as "candidate points". These candidate points include the endpoints of the interval and any critical points of the function.
You can use the Candidates Test by following these steps:
- Identify the interval on which you want to find the absolute extrema.
- Find the critical points of the function by solving the equation or by finding the points where is undefined.
- Evaluate the function at the critical points and at the endpoints of the interval. These are the candidate points.
- Compare the function values at the candidate points. The largest function value among all candidate points is the absolute maximum, and the smallest function value among all candidate points is the absolute minimum.
It is important to note that the Candidates Test applies only to continuous functions defined on a closed interval.
5.6 Determining Concavity of Functions Over Their Domains
Now that you're pretty comfortable with the first derivative test, let's move on to the second derivative test. The second derivative test is a method used to determine the concavity of a function and its inflection points by analyzing the sign of the second derivative of the function. The second derivative of a function is also known as the curvature of the function, and it tells us the rate of change of the slope of the function at a given point.
Once we have the second derivative, we can analyze its sign at different points in the domain to determine the concavity of the function. Concavity refers to the curvature of a function at a given point. In other words, it tells us whether a function is "bending up" or "bending down" at a particular point. If the second derivative is positive at a point, then the function is concave up at that point, meaning that the curve is upward facing at that point (like a smile 🙂). If the second derivative is negative at a point, then the function is concave down at that point, meaning that the curve is downward facing at that point (like a frown ☹️).
An inflection point is a point on a curve at which the concavity changes. It can be found by setting the equation of the second derivative is equal to zero or by finding the points where the second derivative is undefined.

5.7 Using the Second Derivative Test to Determine Extrema
We can simplify the first derivative test for determining extrema by using the second derivative test.
Here are the steps you need to follow:
- Find the critical points of the function by solving the equation or by finding the points where is undefined.
- Evaluate the second derivative of the function, , at each critical point.
- If is positive at a critical point, then it is a local minimum.
- If is negative at a critical point, then it is a local maximum.
- If is 0 at a critical point, then it is a point of inflection and the test cannot be used to determine if it is a local maxima or minima.
The second derivative test can be used in conjunction with the first derivative test and the Candidates Test for determining the global extrema of a function.
5.8 Sketching Graphs of Functions and Their Derivatives
Visualizing functions and derivatives is a powerful way to understand the relationship between the derivatives and the original function. Graphs can also provide us with a lot of valuable information, such as:
- The domain and range of the function: The domain of a function is the set of all input values for which the function is defined, and the range is the set of all output values. The graph of a function can provide a visual representation of the domain and range of the function.
- The relative maxima and minima: The graph of a function can help identify the relative maxima and minima of the function, which are the points where the function has the highest and lowest values, respectively, within a specific interval. These can be identified by looking for the points on the graph where the slope of the function changes from increasing to decreasing or vice versa.
- Critical points: The graph of a function's derivative can help identify the critical points of the function, which are the points where the function's derivative is either 0 or undefined. These points are important in determining the extrema of the function.
- Concavity: The graph of a function can help identify the concavity of the function, which is whether the function is "bending up" or "bending down" at a particular point. This can be determined by looking at the graph of the function's derivative, which will be positive for concave up and negative for concave down.
- Asymptotes: The graph of a function can help identify asymptotes, which are lines that the graph of the function approaches but never touches or intersects.
- Inflection Points: The graph of a function can help identify inflection points, which are the points on a curve at which the concavity changes.
5.9 Connecting a Function, Its First Derivative, and Its Second Derivative
The AP exam will likely ask you to choose the graph of a function based on the graph of one of its derivatives. You need to know how the key points of a function are represented across all three graphs.
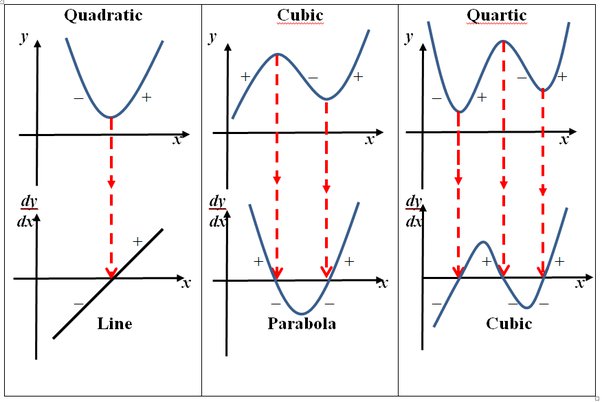
Let's look at the quadratic function in the image above. The derivative of the quadratic is a straight line with a positive slope. When the line is below the x-axis, the slope of the quadratic is negative, and the original function is decreasing. When the line is above the x-axis, the slope of the quadratic is positive, and the original function is increasing. Try drawing parallels between the graphs of the cubic and quartic (x to the power of 4) functions and their derivatives for more practice.
5.10 & 5.11 Introduction to & Solving Optimization Problems
Optimization problems are mathematical problems that involve finding the best solution among a set of possible solutions. These problems can be classified into two types: minimization and maximization problems. Minimization problems involve finding the minimum value of a function, while maximization problems involve finding the maximum value of a function.
There are two ways to solve optimization problems, including:
- Graphical Method: This method involves sketching the graph of the function and visually identifying the critical points and extrema.
- Analytical Method: This method involves using mathematical techniques such as the first and second derivative tests to find the critical points and extrema of the function.
You will mostly be using the analytical method to solve optimization problems. Optimization can be applied in various fields such as physics, engineering, economics and finance, and it is used to design products, processes, and policies that are efficient and cost-effective.