📚AP Statistics Unit 4 Review
4.1 Sampling Distributions for Sample Means
4.1 Sampling Distributions for Sample Means
Unit & Topic Study Guides
Unit 1 – Exploring One–Variable Data and Collecting Data
Unit 2 – Probability, Random Variables, and Probability Distributions
Unit 3 – Inference for Categorical Data: Proportions
Unit 4 – Inference for Quantitative Data: Means
Unit 5 – Regression Analysis
AP Statistics Exam
Statistical Practices
Exam Skills
The sampling distribution of the sample mean has center and standard deviation . It is normal when the population is normal and approximately normal when the sample size is large enough, commonly , thanks to the Central Limit Theorem.
Why This Matters for the AP Statistics Exam
This topic is the bridge between probability and inference. Once you can describe the center, spread, and shape of the distribution of x̄, you can calculate how likely a sample mean is, and later build confidence intervals and run tests for population means. On the exam, you may see multiple-choice questions that ask you to find σ/√n, decide whether normality holds, or compute a probability for x̄. On free-response questions, you may need to state conditions, show your calculation, and interpret the result in context with correct units.

Key Takeaways
- The mean of the sampling distribution of x̄ equals the population mean: μx̄ = μ. This makes x̄ an unbiased estimator of μ.
- The standard deviation of x̄ is σx̄ = σ/√n. As n grows, this gets smaller, so larger samples give means that cluster tighter around μ.
- If the population is normal, the sampling distribution of x̄ is normal for any sample size.
- If the population is not normal, the sampling distribution of x̄ is approximately normal when n is large enough, typically n ≥ 30 (Central Limit Theorem).
- The σ/√n formula assumes sampling with replacement. If you sample without replacement and n is less than 10% of the population, the difference is negligible.
- To find a probability for x̄, convert to a z-score using z = (x̄ − μ) / (σ/√n), then use the normal model.
Formulas
For these problems you work with the sample mean x̄. The mean of the sampling distribution of x̄ is equal to the population mean μ.
The key parameters are:
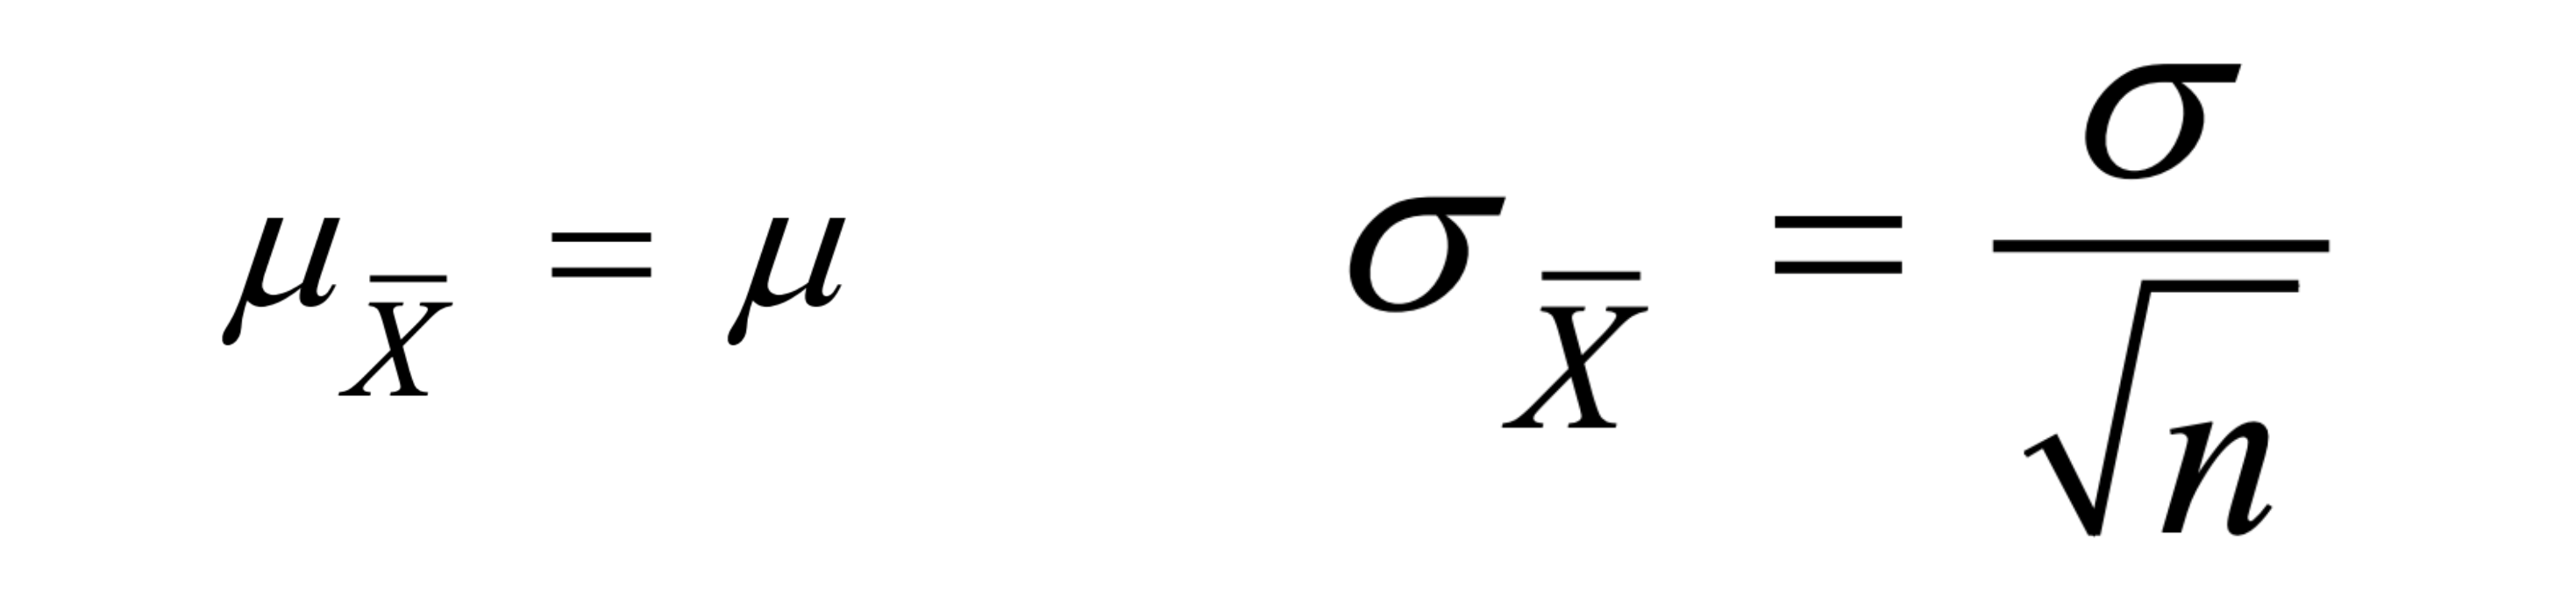
- Mean of x̄: μx̄ = μ
- Standard deviation of x̄: σx̄ = σ/√n
The standard deviation of the sampling distribution, σ/√n, is sometimes called the standard error of the mean. Watch your notation here: σ is the population standard deviation, while σ/√n describes how much the sample mean varies from sample to sample. They are not the same number.
Normal Condition: Central Limit Theorem
When you are working with numerical data and you want to make statements about a population mean, you can use the sampling distribution of the sample mean x̄. Before you treat it as normal, you need to check the shape.
There are two ways the sampling distribution of x̄ can be modeled as normal:
- If the population distribution is normal, then the sampling distribution of x̄ is normal for any sample size.
- If the population distribution is not normal, the sampling distribution of x̄ is approximately normal when the sample size is large enough.
The "large enough" sample size is commonly taken to be 30 or greater. This is the idea behind the Central Limit Theorem: as the sample size increases, the sampling distribution of the sample mean becomes approximately normal, regardless of the shape of the population distribution. The Central Limit Theorem also requires that the sample values are independent of each other.
How to Use This on the AP Statistics Exam
Problem Solving
When a question gives you μ, σ, and n, follow a clear order:
- Find the center: μx̄ = μ.
- Find the spread: σx̄ = σ/√n.
- Check the shape: is the population normal, or is n ≥ 30? State your reason.
- If normal, convert to a z-score with z = (x̄ − μ) / (σ/√n) and find the probability.
Free Response
State the conditions before you calculate. Name why the distribution is approximately normal (population normal or large sample size), show the standard deviation calculation, and then interpret your probability in context. Using the right notation and including units makes your work clear and easy to follow.
Common Trap
Do not use σ by itself when you want the spread of sample means. The spread of x̄ is σ/√n, which is smaller. Plugging in the raw population standard deviation is one of the most common mistakes on these problems.
Practice Problem
Suppose that you are conducting a study to estimate the average income of small business owners in your state. You decide to use a simple random sample of 100 small business owners, and you collect data on their annual incomes. After analyzing the data, you find that the sample mean income is $50,000 per year with a standard deviation of $10,000.
a) Explain what the sampling distribution for the sample mean represents and why it is useful in this situation.
b) Suppose that the true population mean income for small business owners in your state is actually $45,000 per year. Describe the shape, center, and spread of the sampling distribution for the sample mean in this case.
c) Explain why the Central Limit Theorem applies to the sampling distribution for the sample mean in this situation.
d) Discuss one potential source of bias that could affect the results of this study, and explain how it could influence the estimate of the population mean income.
Answer
a) The sampling distribution for the sample mean represents the distribution of possible values for the sample mean if the study were repeated many times. It is useful here because it lets you make inferences about the population mean based on the sample data.
b) If the true population mean income is $45,000 per year, the sampling distribution for the sample mean would be approximately normal with a center at $45,000 and a spread that depends on the sample size and the variability of the population (σ/√n).
c) The Central Limit Theorem applies because the sample size (n = 100) is large enough for the sampling distribution to be approximately normal, even if the population is not normally distributed.
d) One potential source of bias in this study could be selection bias, which occurs when certain groups of individuals are more or less likely to be included in the sample. For example, if the sample is drawn from a list of small business owners who registered with a particular organization, it could be biased toward those who are more financially successful or more likely to be active members. This could lead to an overestimate of the population mean income.
On the other hand, if the sample is drawn from a list of small business owners who applied for a particular loan program, it could be biased toward those who are less financially successful or more likely to need financial assistance. This could lead to an underestimate of the population mean income.
Common Misconceptions
- "The sample mean equals the population mean." Not exactly. On average x̄ equals μ, but any single sample mean varies. The sampling distribution describes that variation.
- "The spread of x̄ is just σ." The spread is σ/√n, which shrinks as n increases. Larger samples produce sample means that are closer to μ.
- "The Central Limit Theorem makes the population normal." It does not change the population. It describes the shape of the distribution of sample means when n is large enough.
- "You always need n ≥ 30." If the population is already normal, the sampling distribution of x̄ is normal for any sample size. The n ≥ 30 guideline is for non-normal populations.
- "Standard error and standard deviation are the same thing." The standard error of the mean, σ/√n, measures how much x̄ varies from sample to sample, not how much individual values vary.
Related AP Statistics Guides
Vocabulary
The following words are mentioned explicitly in the AP® course framework for this topic.Term | Definition |
|---|---|
normal distribution | A probability distribution that is mound-shaped and symmetric, characterized by a population mean (μ) and population standard deviation (σ). |
parameter | A numerical summary that describes a characteristic of an entire population. |
population | The entire group of individuals or items from which a sample is drawn and about which conclusions are to be made. |
population distribution | The distribution of all values of a variable across the entire population. |
population mean | The average of all values in an entire population, denoted as μ. |
population means | The average values of two distinct populations being compared, denoted as μ₁ and μ₂. |
population size | The total number of individuals or items in an entire population. |
probability | The likelihood or chance that a particular outcome or event will occur, expressed as a value between 0 and 1. |
random sampling with replacement | A sampling method where each selected item is returned to the population before the next selection, allowing the same item to be selected multiple times. |
random sampling without replacement | A sampling method where each selected item is not returned to the population, so each item can only be selected once. |
sample mean | The average of all values in a sample, denoted as x̄, used as an estimate of the population mean. |
sample size | The number of observations or data points collected in a sample, denoted as n. |
sampling distribution | The probability distribution of a sample statistic (such as a sample proportion) obtained from repeated sampling of a population. |
standard deviation | A measure of how spread out data values are from the mean, represented by σ in the context of a population. |
Frequently Asked Questions
What is the sampling distribution of the sample mean?
It is the distribution of possible sample means x-bar from repeated random samples of the same size from a population. It describes how sample means vary from sample to sample.
What is the mean of the sampling distribution of x-bar?
The mean of the sampling distribution of x-bar equals the population mean mu. That means x-bar is an unbiased estimator of the population mean.
What is the standard deviation of the sampling distribution of x-bar?
For random sampling with replacement, the standard deviation is sigma divided by the square root of n. If sampling without replacement and n is less than 10 percent of the population, the difference is negligible.
When is the sampling distribution of x-bar approximately normal?
It is normal for any sample size if the population is normal. If the population is not normal, it is approximately normal when the sample size is large enough, commonly n at least 30.
How do I find probabilities for sample means?
First identify the mean, standard deviation, and shape of the sampling distribution. If normality is reasonable, convert the sample mean to a z-score and use the normal model.
What is the most common AP Stats mistake with sample means?
Students often use the population standard deviation sigma instead of the standard error sigma divided by square root n. The sampling distribution of x-bar is less spread out than individual observations.