A confidence interval for a difference of population proportions estimates . To justify a claim, check whether 0 is inside the interval.
If the interval includes 0, the data do not provide sufficient evidence of a difference. If the interval is entirely above or below 0, the interval supports a directional claim in context.
Why This Matters for the AP Statistics Exam
AP Statistics free-response scoring rewards clear statistical communication. For this topic, that means naming the parameter, keeping the subtraction order straight, interpreting the interval in context, and using 0 correctly when deciding whether the interval supports a claim.

Interpretation
When interpreting a confidence interval for the difference in two population proportions, we need to show that the bounds given by the confidence interval give us an estimate of what the difference in our two population proportions are within. Our interpretation and interval are also strongly based on what our confidence level is. The standard confidence level is 95%. In repeated random sampling with the same sample size and method, about 95% of confidence intervals constructed this way will capture the true difference in population proportions, p1 − p2.
When completing a confidence interval on the AP Statistics Exam, you will generally be graded on if you included the following components:
-
Including confidence level (given in problem)
-
Including that our interval is making inference about the difference in population proportions, not sample proportions.
-
Including context of the problem.
-
Reference the sample and population: identify how the data were obtained (e.g., random sample/assignment) and state the population the sample represents. Also clearly define the parameter and the order of subtraction (for example, p1 − p2, where p1 and p2 are named in context).
Testing a Claim
When you construct a confidence interval for the difference between two population proportions to test a claim, you want to see if 0 is included in the interval.
- If it is, it means that there is a reasonable level of uncertainty about whether the two population proportions are different, and you cannot (or fail to) reject the null hypothesis that there is no difference between the two proportions.
- If 0 is not included in the interval, it suggests that the two population proportions are likely different, and you can reject the null hypothesis in favor of the alternative hypothesis.
This CI-based decision aligns with a two-sided hypothesis test at significance level α = 1 − confidence level (e.g., a 95% CI corresponds to α = 0.05). For one-sided claims, ensure the entire interval lies on the appropriate side of 0.
Use these in-context templates to justify a claim:
- If the entire interval is above 0, this supports the claim that p1 > p2; in context: [define p1 and p2], and we estimate the difference p1 − p2 to be between L and U.
- If the entire interval is below 0, this supports the claim that p1 < p2; in context: [define p1 and p2], and the magnitude of the difference is between |U| and |L|.
- If the interval includes 0, we do not have sufficient evidence to conclude a difference in the population proportions.
Example
Recall from Unit 6.8 we constructed a confidence interval for the difference in proportions for shots made for Michael Jordan and Lebron James. We got the following output from our calculator:
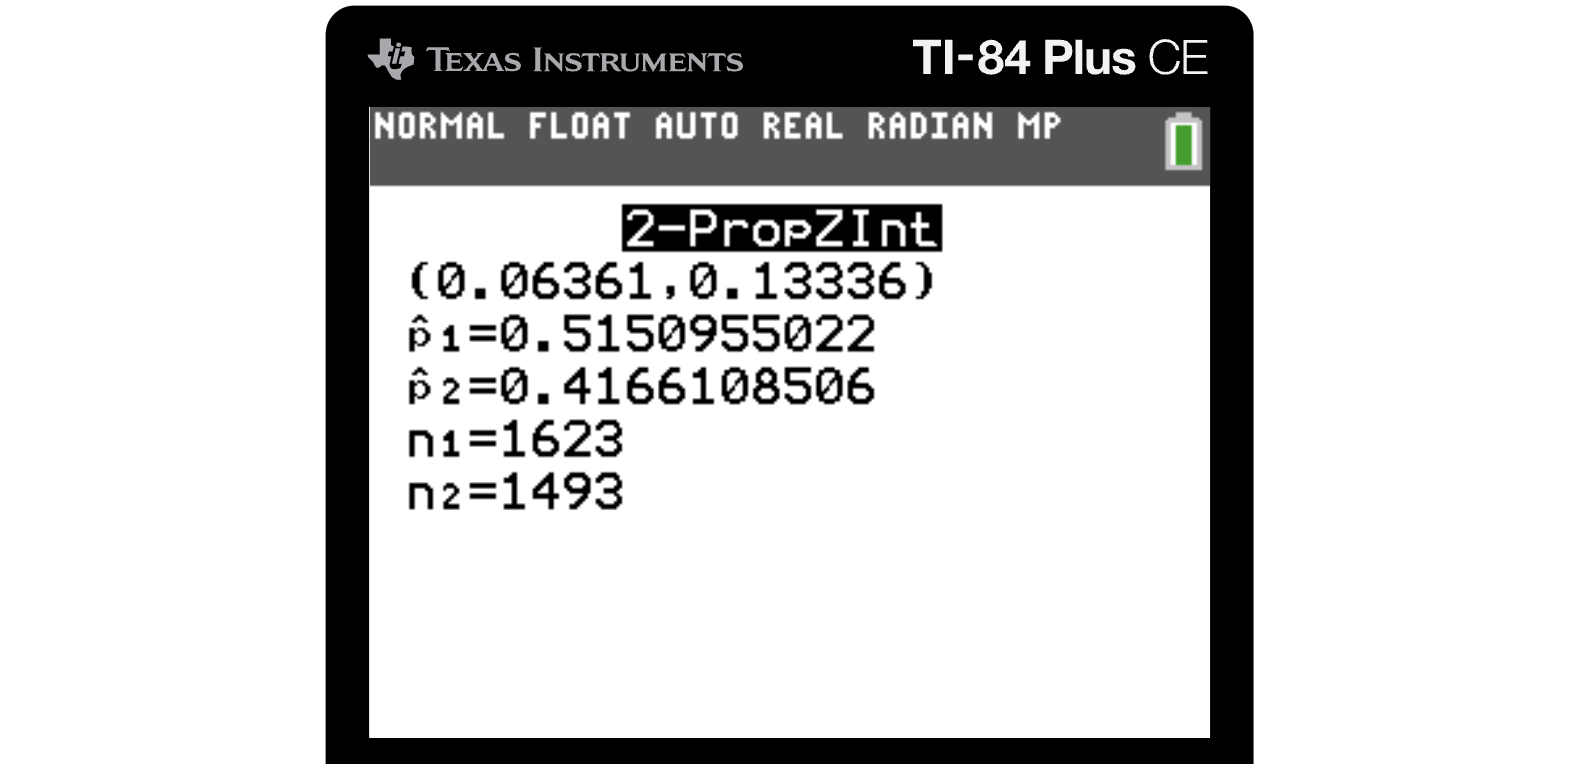
A correct way to interpret this would be:
"Let p_MJ be the population proportion of made shots for Michael Jordan (first season) and p_LJ for LeBron James (first season). We are 95% confident that p_MJ − p_LJ is between 0.063 and 0.133. Since the entire interval is above 0, we have evidence that MJ's true make proportion exceeds LeBron's by between 6.3 and 13.3 percentage points (in their first seasons)."
These data were obtained from samples of shots from each player’s first NBA season and are intended to represent the population of shots each player would take in that season.
So it appears that MJ is better than Lebron.
However, the conclusion is limited to the populations represented by the samples. If we compare different seasons, different shot types, or different team contexts, the estimated difference could change. Teammates, shot selection, and era are all possible confounding variables.
Vocabulary
The following words are mentioned explicitly in the College Board Course and Exam Description for this topic.Term | Definition |
|---|---|
confidence interval | A range of values, calculated from sample data, that is likely to contain the true population parameter with a specified level of confidence. |
difference in proportions | The difference between two population proportions, calculated as p₁ - p₂, used to compare the prevalence of a characteristic across two populations. |
population proportion | The true proportion or percentage of a characteristic in an entire population, typically denoted as p. |
random sampling | A method of selecting samples from a population where each member has an equal chance of being chosen, ensuring the sample is representative of the population. |
sample size | The number of observations or data points collected in a sample, denoted as n. |
Frequently Asked Questions
What is a confidence interval for a difference of population proportions?
It is an interval estimate for p1 - p2, the difference between two population proportions. The order of subtraction must match the way the groups are defined.
How do you use a confidence interval to justify a claim about proportions?
Check whether 0 is in the interval. If 0 is outside the interval, the interval supports a claim that the population proportions differ in the direction shown by p1 - p2.
What does it mean if 0 is in a confidence interval for p1 - p2?
If 0 is in the interval, the data do not provide sufficient evidence that the two population proportions are different at the matching significance level.
What does it mean if the whole interval is above 0?
If the entire interval is above 0, the interval supports the claim that p1 is greater than p2, assuming p1 - p2 is the defined subtraction order.
What should an AP Stats interpretation include?
Include the confidence level, the parameter p1 - p2, the sample/population context, and the actual interval values. Avoid saying the probability that the true parameter is in this specific interval.