Fiveable

📊AP Statistics Unit 6 Review

QR code for AP Statistics practice questions

6.3 Justifying a Claim Based on a Confidence Interval for a Population Proportion

📊AP Statistics
Unit 6 Review

6.3 Justifying a Claim Based on a Confidence Interval for a Population Proportion

Written by the Fiveable Content Team • Last updated September 2025
Verified for the 2026 exam
Verified for the 2026 examWritten by the Fiveable Content Team • Last updated September 2025
Pep mascot

A confidence interval for a population proportion is based on sample data and is used to estimate the likely range of values for the population proportion. The confidence interval is constructed at a specific confidence level, which determines the probability that the interval contains the true population proportion.

Since each confidence interval is based on a random sample of data, the interval will either contain the population proportion or it will not. There is a specified probability, based on the confidence level, that the interval will contain the true population proportion. For example, if the confidence level is 95%, there is a 95% probability that the interval contains the true population proportion.

Concluding a Confidence Interval

Let's return to our confidence interval that was given before:

We are estimating a 95% confidence interval of what proportion of high school math students pass their class. We were given a sample of 85 students where ~75% of them passed. We calculated a confidence interval for the true population proportion based off of our sample. The interval is given in the calculator output below:

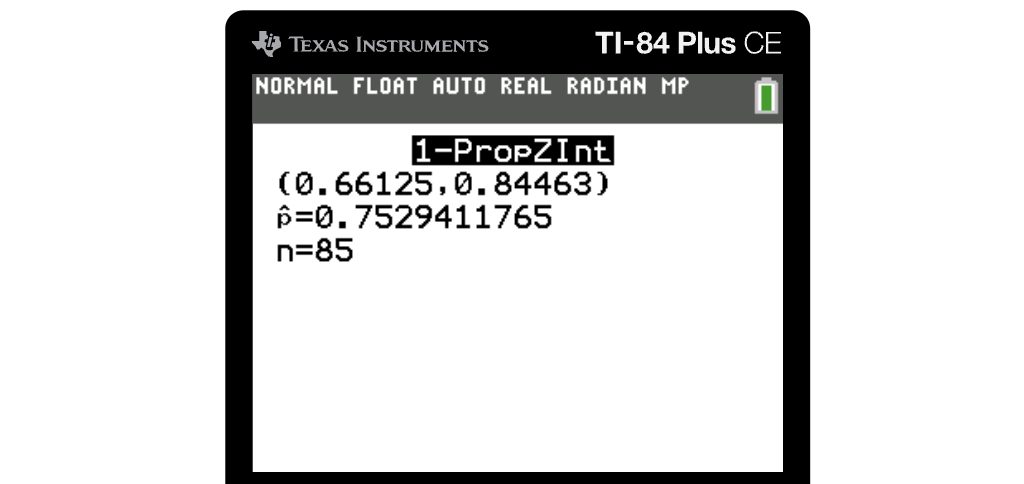
We are given the 95% confidence interval (0.66125, 0.84463) as an estimate of the population proportion of high school students who are passing their math class.

Pep mascot
more resources to help you study

Huh? What the Heck Does This Mean?

In terms of what this means, it means we are 95% confident that the true population proportion of high school students who pass their math class is between 0.66125 and 0.84463. Notice that both of our endpoints are decimals less than 1. This is because we are estimating a proportion, which is always between 0 and 1. Anytime we are calculating any type of proportion, our answer should always be between 0 and 1. 

Interpretation Templates

Interpreting a confidence interval for a one-sample proportion should include a reference to the sample taken and details about the population it represents.

  • "We are C% (90%, 95%, 99%, etc.) confident that the confidence interval for a population proportion captures the population proportion of (CONTEXT)."

Example: For interpreting a 99% confidence interval of (0.268, 0.292), based on the proportion of a nationally representative sample of twelfth-grade students who answered a particular multiple choice question correctly: “We are 99 percent confident that the interval from 0.268 to 0.292 contains the population proportion of all United States twelfth-grade students who would answer this question correctly”

  • "In repeated random sampling with the same sample size, approximately C% of confidence intervals created will capture the population proportion of (CONTEXT)."

The Big Three

When interpreting a confidence interval for a population proportion, there are three things necessary to receive full credit: confidence level, context, and reference to true population proportion.

(1) Confidence Level

Our confidence level is generally given in the problem. This is the 95%, 90%, 98%, etc. This impacts the z* for our confidence interval and is necessary in including in our interpretation of the interval.

(2) Context

As with anything in AP Stats, context is essential to receive full credit. Anytime we write out an answer, we need to include it in context of the problem being asked. It is no different when interpreting a confidence interval. We need to ask ourselves, "What is this interval estimating?" and include that in our response.

(3) True Population Parameter

We also need to be sure that our answer implies that we are estimating a population proportion, not just a sample proportion. After all, there's no reason to estimate something for our sample because we have the EXACT sample proportion as it was given to us. We are using that sample to estimate the bigger picture with our population.

Testing a Claim Using Intervals

When we are given a population proportion that maybe we don't necessarily believe, we can use a confidence interval based off of a random sample to test that claim. The main way we are going to check the statistical claim is by seeing if the claimed population proportion is within our confidence interval. If it is in our confidence interval, then it is possible that the claim is true. If the claimed value is not in our interval, we may need to investigate further to see if the claim made by an article/study is in fact false.

Example

In our example above dealing with students passing their math class, let's say that we recently read an article that said only 55% of all US students are passing their math class. Therefore, we took a random sample of 85 US math students and we were given the interval above: (0.66125, 0.84463).

Since 0.55 is not in our interval, we have reason to doubt the article that we read. We should definitely investigate it further.

Important Note!

When we are given a claim that we are checking, our expected successes and failures change for our Large Counts Condition that we checked in Unit 6.2. Now that we are given a supposed proportion to be true for the population, we use that to calculate our expected successes and failures. So our large counts condition would change to 0.55(85) ≥ 10 & 0.45(85) ≥ 10, which still holds for this particular problem.

In other words, when we are given an actual p to check this condition, use it. When we aren't given a p-value, use the next best thing by using your p-hat.

Sample Size, Confidence Interval Width, Confidence Level, and Margin of Error

Confidence Interval Width & Sample Size -- INVERSE relationship: When all other things remain the same, the width of the confidence interval for a population proportion tends to decrease as the sample size increases. For a population proportion, the width of the interval is proportional to 1/sqrt(n). This is because as the sample size increases, the standard deviation of the sampling distribution decreases, which results in a narrower confidence interval. 

Confidence Interval Width & Confidence Level -- DIRECT relationship: For a given sample, the width of the confidence interval for a population proportion increases as the confidence level increases. This is because a higher confidence level results in a wider confidence interval, as the interval is constructed using a larger critical value.

Confidence Interval Width & Margin of Error -- 2 x MOE = Width: The width of a confidence interval for a population proportion is exactly twice the margin of error. Recall that width of the interval is calculated by adding and subtracting twice the margin of error to the sample proportion.

🎥 Watch: AP Stats - Inference: Confidence Intervals for Proportions

Vocabulary

The following words are mentioned explicitly in the College Board Course and Exam Description for this topic.

TermDefinition
claimA statement or assertion about a population parameter that can be evaluated using statistical evidence.
confidence intervalA range of values, calculated from sample data, that is likely to contain the true population parameter with a specified level of confidence.
confidence levelThe probability that a confidence interval will contain the true population parameter, typically expressed as a percentage such as 90%, 95%, or 99%.
margin of errorThe amount by which a sample statistic is likely to vary from the corresponding population parameter, calculated as the critical value times the standard error.
one-sample proportionA confidence interval or hypothesis test that estimates or tests a single population proportion based on data from one sample.
population proportionThe true proportion or percentage of a characteristic in an entire population, typically denoted as p.
random sampleA sample selected from a population in such a way that every member has an equal chance of being chosen, reducing bias and allowing for valid statistical inference.
sample sizeThe number of observations or data points collected in a sample, denoted as n.
width of a confidence intervalThe range or span of a confidence interval, calculated as the difference between the upper and lower bounds of the interval.

Frequently Asked Questions

How do I justify a claim using a confidence interval for population proportion?

Make a CI for the population proportion p (p̂ ± z*·√[p̂(1−p̂)/n]) and then see whether the claimed value lies inside the interval. Steps to justify a claim: - Compute the interval from your sample (report p̂, n, confidence level, z*, and margin of error). - State the AP-style interpretation: “We are C% confident that the interval from a to b contains the true proportion of [population in context].” (UNC-4.F.2, UNC-4.F.4) - Compare the claim value to the interval: - If the claimed proportion is inside the CI → the claim is plausible given the data (CI provides sufficient evidence to support the claim in context; UNC-4.G.1). - If it’s outside → the data do not support the claim (claim unlikely). - Also note conditions (random sample, and normal approximation for p̂) and mention how changing n or confidence level affects width (1/√n relationship; wider for higher C). Example: claim p = 0.60 and 95% CI = (0.55, 0.68). Because 0.60 is inside the interval, the data are consistent with the claim. For a quick walkthrough and more examples, see the Fiveable study guide for this topic (https://library.fiveable.me/ap-statistics/unit-6/justifying-claim-based-on-confidence-interval-for-population-proportion/study-guide/YeTpyj6nyq03j0AJO3Bm). For extra practice problems, try Fiveable’s AP Stats practice page (https://library.fiveable.me/practice/ap-statistics).

What's the formula for confidence interval for population proportion?

Confidence interval for a population proportion: p̂ ± z* · SE(p̂), where SE(p̂) = sqrt[ p̂(1 − p̂) / n ]. So CI = p̂ ± z* · sqrt[ p̂(1 − p̂) / n ] and the margin of error = z* · sqrt[ p̂(1 − p̂) / n ]. For a 95% CI use z* ≈ 1.96 (for other confidence levels use the appropriate z* from the standard normal). Conditions (AP CED): the sample is random and independent, and the normal approximation is okay (np̂ ≥ 10 and n(1−p̂) ≥ 10). Interpret in context: “We are C% confident that the interval from ___ to ___ contains the true population proportion,” and use the sample & population described (UNC-4.F.4). Width considerations: width = 2·ME and shrinks like 1/√n as n increases (UNC-4.H). For a topic refresher see the Fiveable study guide (https://library.fiveable.me/ap-statistics/unit-6/justifying-claim-based-on-confidence-interval-for-population-proportion/study-guide/YeTpyj6nyq03j0AJO3Bm) and more Unit 6 review (https://library.fiveable.me/ap-statistics/unit-6). For extra practice, try the AP problems on Fiveable (https://library.fiveable.me/practice/ap-statistics).

When do I use confidence intervals vs hypothesis tests for proportions?

Use a confidence interval when your goal is estimation—you want a range of plausible values for the population proportion p. Use a hypothesis test when you’re evaluating a specific claim (Ho: p = p0) and want a p-value or decision at a significance level. They’re closely related for one-sample proportions: if p0 lies inside a C% confidence interval you do not have strong evidence to reject Ho at the corresponding α (roughly α = 1 − C); if p0 is outside the interval you have evidence against Ho. Practical checklist (AP CED language): both methods require a random/representative sample and the Normal approximation conditions (np̂ and n(1 − p̂) ≳ 10 for CIs; for tests use np0 and n(1 − p0) ≳ 10). CI formula: p̂ ± z*·√[p̂(1−p̂)/n]. One-sample z-test uses z = (p̂ − p0)/√[p0(1−p0)/n]. Remember to interpret intervals in context and mention confidence level (UNC-4.F, UNC-4.G). For more review on justifying claims with CIs see the Topic 6.3 study guide (https://library.fiveable.me/ap-statistics/unit-6/justifying-claim-based-on-confidence-interval-for-population-proportion/study-guide/YeTpyj6nyq03j0AJO3Bm). For unit overview and lots of practice problems, check Unit 6 (https://library.fiveable.me/ap-statistics/unit-6) and practice sets (https://library.fiveable.me/practice/ap-statistics).

I'm confused about what it means to be 95% confident - can someone explain?

Being "95% confident" means this about your procedure, not any single interval: if you took many random samples of the same size and built a 95% confidence interval from each, about 95% of those intervals would contain the true population proportion p (CED UNC-4.F.2–F.3). For one interval you might say, for example, "We are 95% confident that the interval 0.42 to 0.50 contains the true proportion of all students who prefer online labs." That wording ties the interval to the sample and the population (UNC-4.F.4). Remember: each interval either does or doesn’t contain p (UNC-4.F.1). Higher confidence (e.g., 99%) gives wider intervals; larger sample size gives narrower intervals (UNC-4.H). For more on interpreting and justifying claims from intervals for proportions, check the Topic 6.3 study guide (https://library.fiveable.me/ap-statistics/unit-6/justifying-claim-based-on-confidence-interval-for-population-proportion/study-guide/YeTpyj6nyq03j0AJO3Bm) and practice lots of problems (https://library.fiveable.me/practice/ap-statistics).

What's the difference between margin of error and confidence interval width?

Margin of error (ME) is the amount you add and subtract from your sample proportion to make the confidence interval: ME = z* × SE(p̂). The confidence interval width is the total length of that interval—from lower to upper bound—and equals 2 × ME. So if p̂ ± ME = (0.30, 0.38), ME = 0.04 and width = 0.08. Key consequences (CED-aligned): ME depends on the critical value (confidence level) and the standard error √[p̂(1−p̂)/n]. Increasing confidence level increases z* and therefore ME and width; increasing sample size decreases SE (proportional to 1/√n), so ME and width shrink. On the AP exam you’ll use the CI formula statistic ± (critical value)(standard error) and you must interpret intervals in context and justify claims (see Topic 6.3 study guide (https://library.fiveable.me/ap-statistics/unit-6/justifying-claim-based-on-confidence-interval-for-population-proportion/study-guide/YeTpyj6nyq03j0AJO3Bm) and Unit 6 overview (https://library.fiveable.me/ap-statistics/unit-6)). For extra practice, try problems at (https://library.fiveable.me/practice/ap-statistics).

How do I interpret a confidence interval for population proportion step by step?

Step-by-step: 1) State the interval and what it’s based on (e.g., "From a random sample of n = 400, 0.56 ± 0.05 → CI = (0.51, 0.61), 95% confidence"). Always mention the sample and the population it represents (CED UNC-4.F.4). 2) Say the confidence: "We are 95% confident that the interval 0.51 to 0.61 contains the true population proportion." That means in repeated random samples of the same size, about 95% of such CIs would capture p (UNC-4.F.2–3). 3) Mention conditions: random sample and normal approximation (np̂ and n(1−p̂) ≥ 10) so the formula p̂ ± z*√[p̂(1−p̂)/n] applies. 4) Justify a claim: if a claimed value (e.g., p0 = 0.50) lies outside the CI, the data provide evidence against it; if it lies inside, the CI does not contradict the claim (UNC-4.G.1). 5) Note width factors: bigger n → narrower CI; higher confidence → wider CI (UNC-4.H). For more examples and practice, see the Fiveable Topic 6.3 study guide (https://library.fiveable.me/ap-statistics/unit-6/justifying-claim-based-on-confidence-interval-for-population-proportion/study-guide/YeTpyj6nyq03j0AJO3Bm) and Unit 6 overview (https://library.fiveable.me/ap-statistics/unit-6). For extra practice problems, try (https://library.fiveable.me/practice/ap-statistics).

If my confidence interval is (0.23, 0.31) and someone claims p = 0.35, how do I justify whether to support or reject their claim?

Your CI (0.23, 0.31) gives the range of plausible values for the population proportion p at whatever confidence level you used. Because 0.35 is NOT inside that interval, 0.35 is not a plausible value given the sample—so you should not support the claim p = 0.35. In AP terms: a confidence interval either contains the population proportion or it does not (UNC-4.F.1). We are C% confident the interval captures p (UNC-4.F.2); since 0.35 lies outside (0.23, 0.31), the data do not provide sufficient evidence to support the claim p = 0.35 at that confidence level (UNC-4.G.1). If you need a formal decision, run a one-sample hypothesis test (H0: p = 0.35)—the conclusion will match the CI result (reject H0 at the comparable α). For more review of this topic see the Fiveable study guide (https://library.fiveable.me/ap-statistics/unit-6/justifying-claim-based-on-confidence-interval-for-population-proportion/study-guide/YeTpyj6nyq03j0AJO3Bm) and extra practice (https://library.fiveable.me/practice/ap-statistics).

Why does increasing sample size make the confidence interval narrower?

The confidence interval gets narrower because a bigger sample reduces sampling variability. For a population proportion the margin of error = z* × SE, where SE = sqrt[p̂(1−p̂)/n]. As n increases SE shrinks like 1/√n, so the whole interval p̂ ± z*SE gets tighter. Example: if you double n, the interval width multiplies by about 1/√2 ≈ 0.707 (so ~30% narrower). Practically: larger n gives a more precise estimate of the true proportion; the confidence level (C%) and z* still control how confident you are, but they don’t change the 1/√n relationship (UNC-4.H.1). This is why sample size planning matters on the AP: you’ll see questions relating width, margin of error, confidence level, and n. For a focused review, see the Topic 6.3 study guide (https://library.fiveable.me/ap-statistics/unit-6/justifying-claim-based-on-confidence-interval-for-population-proportion/study-guide/YeTpyj6nyq03j0AJO3Bm) and try practice problems (https://library.fiveable.me/practice/ap-statistics).

I don't understand how to write the interpretation statement for a confidence interval - what do I need to include?

Write one or two sentences that do these things—every AP-style interpretation needs all four parts: 1. State the confidence level and the interval in context. - Example: “We are 95% confident that the true proportion of all [population] who [response] is between 0.42 and 0.50.” 2. Say what “95% confident” means (long-run wording from the CED). - Example: “If we took many random samples of the same size, about 95% of the intervals we calculate would contain the true population proportion.” 3. Mention the sample and that it represents the population (random/representative). - Example: “This interval is based on a random sample of 500 registered voters.” 4. Use the interval to justify a claim: compare the claimed value to the interval. - If claim value is inside interval: “The claim that p = 0.45 is plausible because 0.45 lies inside the interval.” - If outside: “The claim that p = 0.55 is not supported because 0.55 lies above the interval.” Keep it concise, use p̂, margin of error, or SE only if asked. For more examples and practice, see the Fiveable study guide (https://library.fiveable.me/ap-statistics/unit-6/justifying-claim-based-on-confidence-interval-for-population-proportion/study-guide/YeTpyj6nyq03j0AJO3Bm) and practice problems (https://library.fiveable.me/practice/ap-statistics).

What happens to confidence interval width when I change from 90% to 99% confidence?

If you keep the same sample and go from 90% to 99% confidence, the interval gets wider. Reason: margin of error = z* · sqrt(p̂(1−p̂)/n). With n and p̂ fixed, only z* changes—z* ≈ 1.645 for 90% and ≈ 2.576 for 99%. So the margin of error (and therefore the interval width, which is 2·ME) increases by a factor of about 2.576/1.645 ≈ 1.57. In plain terms: a 99% CI is roughly 57% wider than a 90% CI for the same sample. That’s why higher confidence means more certainty but less precision (UNC-4.H.2; width = 2·margin of error). For practice building intuition and problems on this topic, see the Topic 6.3 study guide (https://library.fiveable.me/ap-statistics/unit-6/justifying-claim-based-on-confidence-interval-for-population-proportion/study-guide/YeTpyj6nyq03j0AJO3Bm) and more practice at (https://library.fiveable.me/practice/ap-statistics).

How do I know if a confidence interval provides sufficient evidence to support a claim?

If a confidence interval gives enough evidence for a claim, check where the claim’s value sits relative to the interval and interpret in context. For a one-sample proportion CI: - If the claim is “p = p0”: the CI supports the claim only if p0 lies inside the interval. - If the claim is “p > p0”: the CI supports it if the entire interval lies above p0. - If the claim is “p < p0”: the CI supports it if the entire interval lies below p0. Always state the confidence (e.g., “We are 95% confident the population proportion is between ___ and ___”) and mention the sample and population (CED UNC-4.F.4). Remember CI either contains the true p or it doesn’t; repeating the sampling process would capture p about C% of the time (UNC-4.F.1–F.3). Also verify conditions (random sample, np̂ and n(1−p̂) large enough) and note wider CIs with higher confidence or smaller n (UNC-4.H). For a quick topic review, see Fiveable’s study guide (https://library.fiveable.me/ap-statistics/unit-6/justifying-claim-based-on-confidence-interval-for-population-proportion/study-guide/YeTpyj6nyq03j0AJO3Bm) and practice problems (https://library.fiveable.me/practice/ap-statistics).

Can someone explain why width equals 2 times margin of error?

Think of a confidence interval for a proportion in the standard "center ± margin of error" form: p̂ ± z*·SE, where SE = sqrt(p̂(1−p̂)/n) and z* is the critical value for your confidence level. The margin of error (ME) is z*·SE—that’s the distance from the center to either endpoint. The width of the whole interval = (upper bound) − (lower bound) = (p̂ + ME) − (p̂ − ME) = 2·ME. So the interval’s total span is just twice the one-sided distance you add/subtract (the margin of error). This is why UNC-4.H.3 in the CED states the width is exactly 2·ME. The AP formula sheet gives the CI as “statistic ± (critical value)(standard error),” which directly shows this relationship. For more review on justifying claims with proportion CIs, see the Topic 6.3 study guide (https://library.fiveable.me/ap-statistics/unit-6/justifying-claim-based-on-confidence-interval-for-population-proportion/study-guide/YeTpyj6nyq03j0AJO3Bm) and extra practice (https://library.fiveable.me/practice/ap-statistics).

I missed class - what's the relationship between n and confidence interval width for proportions?

Short answer: bigger n → narrower CI for a proportion. The margin of error for a one-sample proportion CI is ME = z* × sqrt[p̂(1 − p̂) / n], and the confidence interval width = 2 × ME. So when everything else is fixed (same p̂ and same confidence level), the width is proportional to 1/√n (CED UNC-4.H.1). That means a 4× larger sample gives half the width; doubling n multiplies the width by about 1/√2 ≈ 0.707. Remember: increasing the confidence level (e.g., 95% → 99%) increases z* and therefore widens the interval (CED UNC-4.H.2). Also check inference conditions (normal approximation: np̂ and n(1−p̂) large enough) before using the z* formula—the AP exam expects you to verify conditions. For a quick review, see the Topic 6.3 study guide (https://library.fiveable.me/ap-statistics/unit-6/justifying-claim-based-on-confidence-interval-for-population-proportion/study-guide/YeTpyj6nyq03j0AJO3Bm) and try practice problems at (https://library.fiveable.me/practice/ap-statistics).

How do I use my calculator to find confidence intervals for population proportions?

Use your graphing calculator’s one-proportion CI routine (AP exam lets a graphing calculator). On a TI-83/84: Stat → TESTS → 1-PropZInt. Enter x = number of successes (or p̂ and n if your model asks), n = sample size, and C-level (e.g., 0.95). Choose “Calculate” and read the interval (LCL, UCL). Before you trust it, check CED conditions: data from a random/representative sample, independence (10% condition), and normal approximation (np̂ ≥ 10 and n(1−p̂) ≥ 10). Interpret the output in context (UNC-4.F): “We are 95% confident the true population proportion of [context] is between LCL and UCL.” To justify a claim (UNC-4.G), see if the claimed proportion lies inside the interval—if it does, the CI provides plausible support; if it’s outside, the claim isn’t supported. For a quick refresher on the ideas and more worked examples, check the Topic 6.3 study guide (https://library.fiveable.me/ap-statistics/unit-6/justifying-claim-based-on-confidence-interval-for-population-proportion/study-guide/YeTpyj6nyq03j0AJO3Bm) and try practice problems (https://library.fiveable.me/practice/ap-statistics).

What does it mean that the interval either contains the true proportion or it doesn't?

That sentence is just reminding you that a single confidence interval is fixed once you compute it—the population proportion p is a single, unknown number, so the interval either does contain p or it doesn’t (there’s no “probability” about that one interval). What the confidence level means is about the long run: if you take many random samples of the same size and build a C% confidence interval from each, about C% of those intervals will capture the true p (CED UNC-4.F.1–F.3). So when you say “We are 95% confident that (a, b) contains p,” you’re saying your method has a 95% success rate in repeated sampling, not that there’s a 95% chance the specific interval contains p. Always interpret the interval in context and mention the sample and population (UNC-4.F.4). See the Fiveable topic study guide for examples (https://library.fiveable.me/ap-statistics/unit-6/justifying-claim-based-on-confidence-interval-for-population-proportion/study-guide/YeTpyj6nyq03j0AJO3Bm) and extra practice (https://library.fiveable.me/practice/ap-statistics).