📚AP Statistics Unit 1 Review
1.11 Random Sampling
1.11 Random Sampling
Unit & Topic Study Guides
Unit 1 – Exploring One–Variable Data and Collecting Data
Unit 2 – Probability, Random Variables, and Probability Distributions
Unit 3 – Inference for Categorical Data: Proportions
Unit 4 – Inference for Quantitative Data: Means
Unit 5 – Regression Analysis
AP Statistics Exam
Statistical Practices
Exam Skills
TLDR
Random sampling means using chance to decide who or what ends up in your sample, which is what lets you generalize results to a population. In revised Unit 1, this topic focuses on the main random sampling methods: simple random sample (SRS), stratified, cluster, systematic, and a census. The method you pick depends on the question and the population, and each one has trade-offs.

Why This Matters for the AP Statistics Exam
This topic builds the skill of identifying a sampling method from a description and explaining why it fits or does not fit a situation. That shows up in multiple-choice questions where you match a scenario to a method, and in free-response questions where you justify a choice or describe how to carry out a sampling plan.
The bigger payoff is generalization. Only randomly selected (or otherwise representative) samples let you make trustworthy claims about a population. Getting comfortable with these methods now sets up the inference work in later units, where everything depends on how the data were collected.
When you answer free-response prompts here, use precise language. Random selection is about choosing who goes in the sample so you can generalize. Random assignment is a different idea used in experiments. Mixing them up is a common way students lose credit.
Key Takeaways
- A simple random sample (SRS) gives every group of a given size an equal chance of being chosen. It is the foundation for many other methods.
- Stratified sampling splits the population into similar groups (strata), then takes an SRS from each, which can reduce variability and improve precision.
- Cluster sampling splits the population into groups (clusters), randomly picks whole clusters, and collects data from everyone inside the chosen clusters.
- Systematic random sampling uses a random starting point and then selects every kth member.
- A census collects data from every member of the population.
- "Without replacement" means each item can be chosen only once; "with replacement" means an item can be chosen more than once.
Random Sampling Methods
Random sampling uses a chance process to decide which members of a population go into your sample. That chance process is what protects you from bias and lets you generalize to the population.
Before the methods, one quick definition. When an item from a population can be selected only once, that is sampling without replacement. When an item can be selected more than once, that is sampling with replacement.
Simple Random Sample (SRS)
A simple random sample (SRS) is a sample in which every group of a given size has an equal chance of being chosen. This also means every individual has an equal chance of being selected.
Common ways to get an SRS:
- Number each individual and use a random number generator to pick which ones to include, ignoring repeats.
- Use a table of random numbers.
- Draw cards from a deck without replacement.
The SRS is the basis for many other sampling mechanisms, which is why it shows up so often.
Choosing an SRS using a TI-84 Calculator
- Label each individual in the population with a different label from 1 to N, where N is the total number of individuals.
- Use a random number generator to get n different integers from 1 to N, where n is the sample size. Ignore repeats.
- Select the individuals matching the labels you generated.
Stratified Random Sample
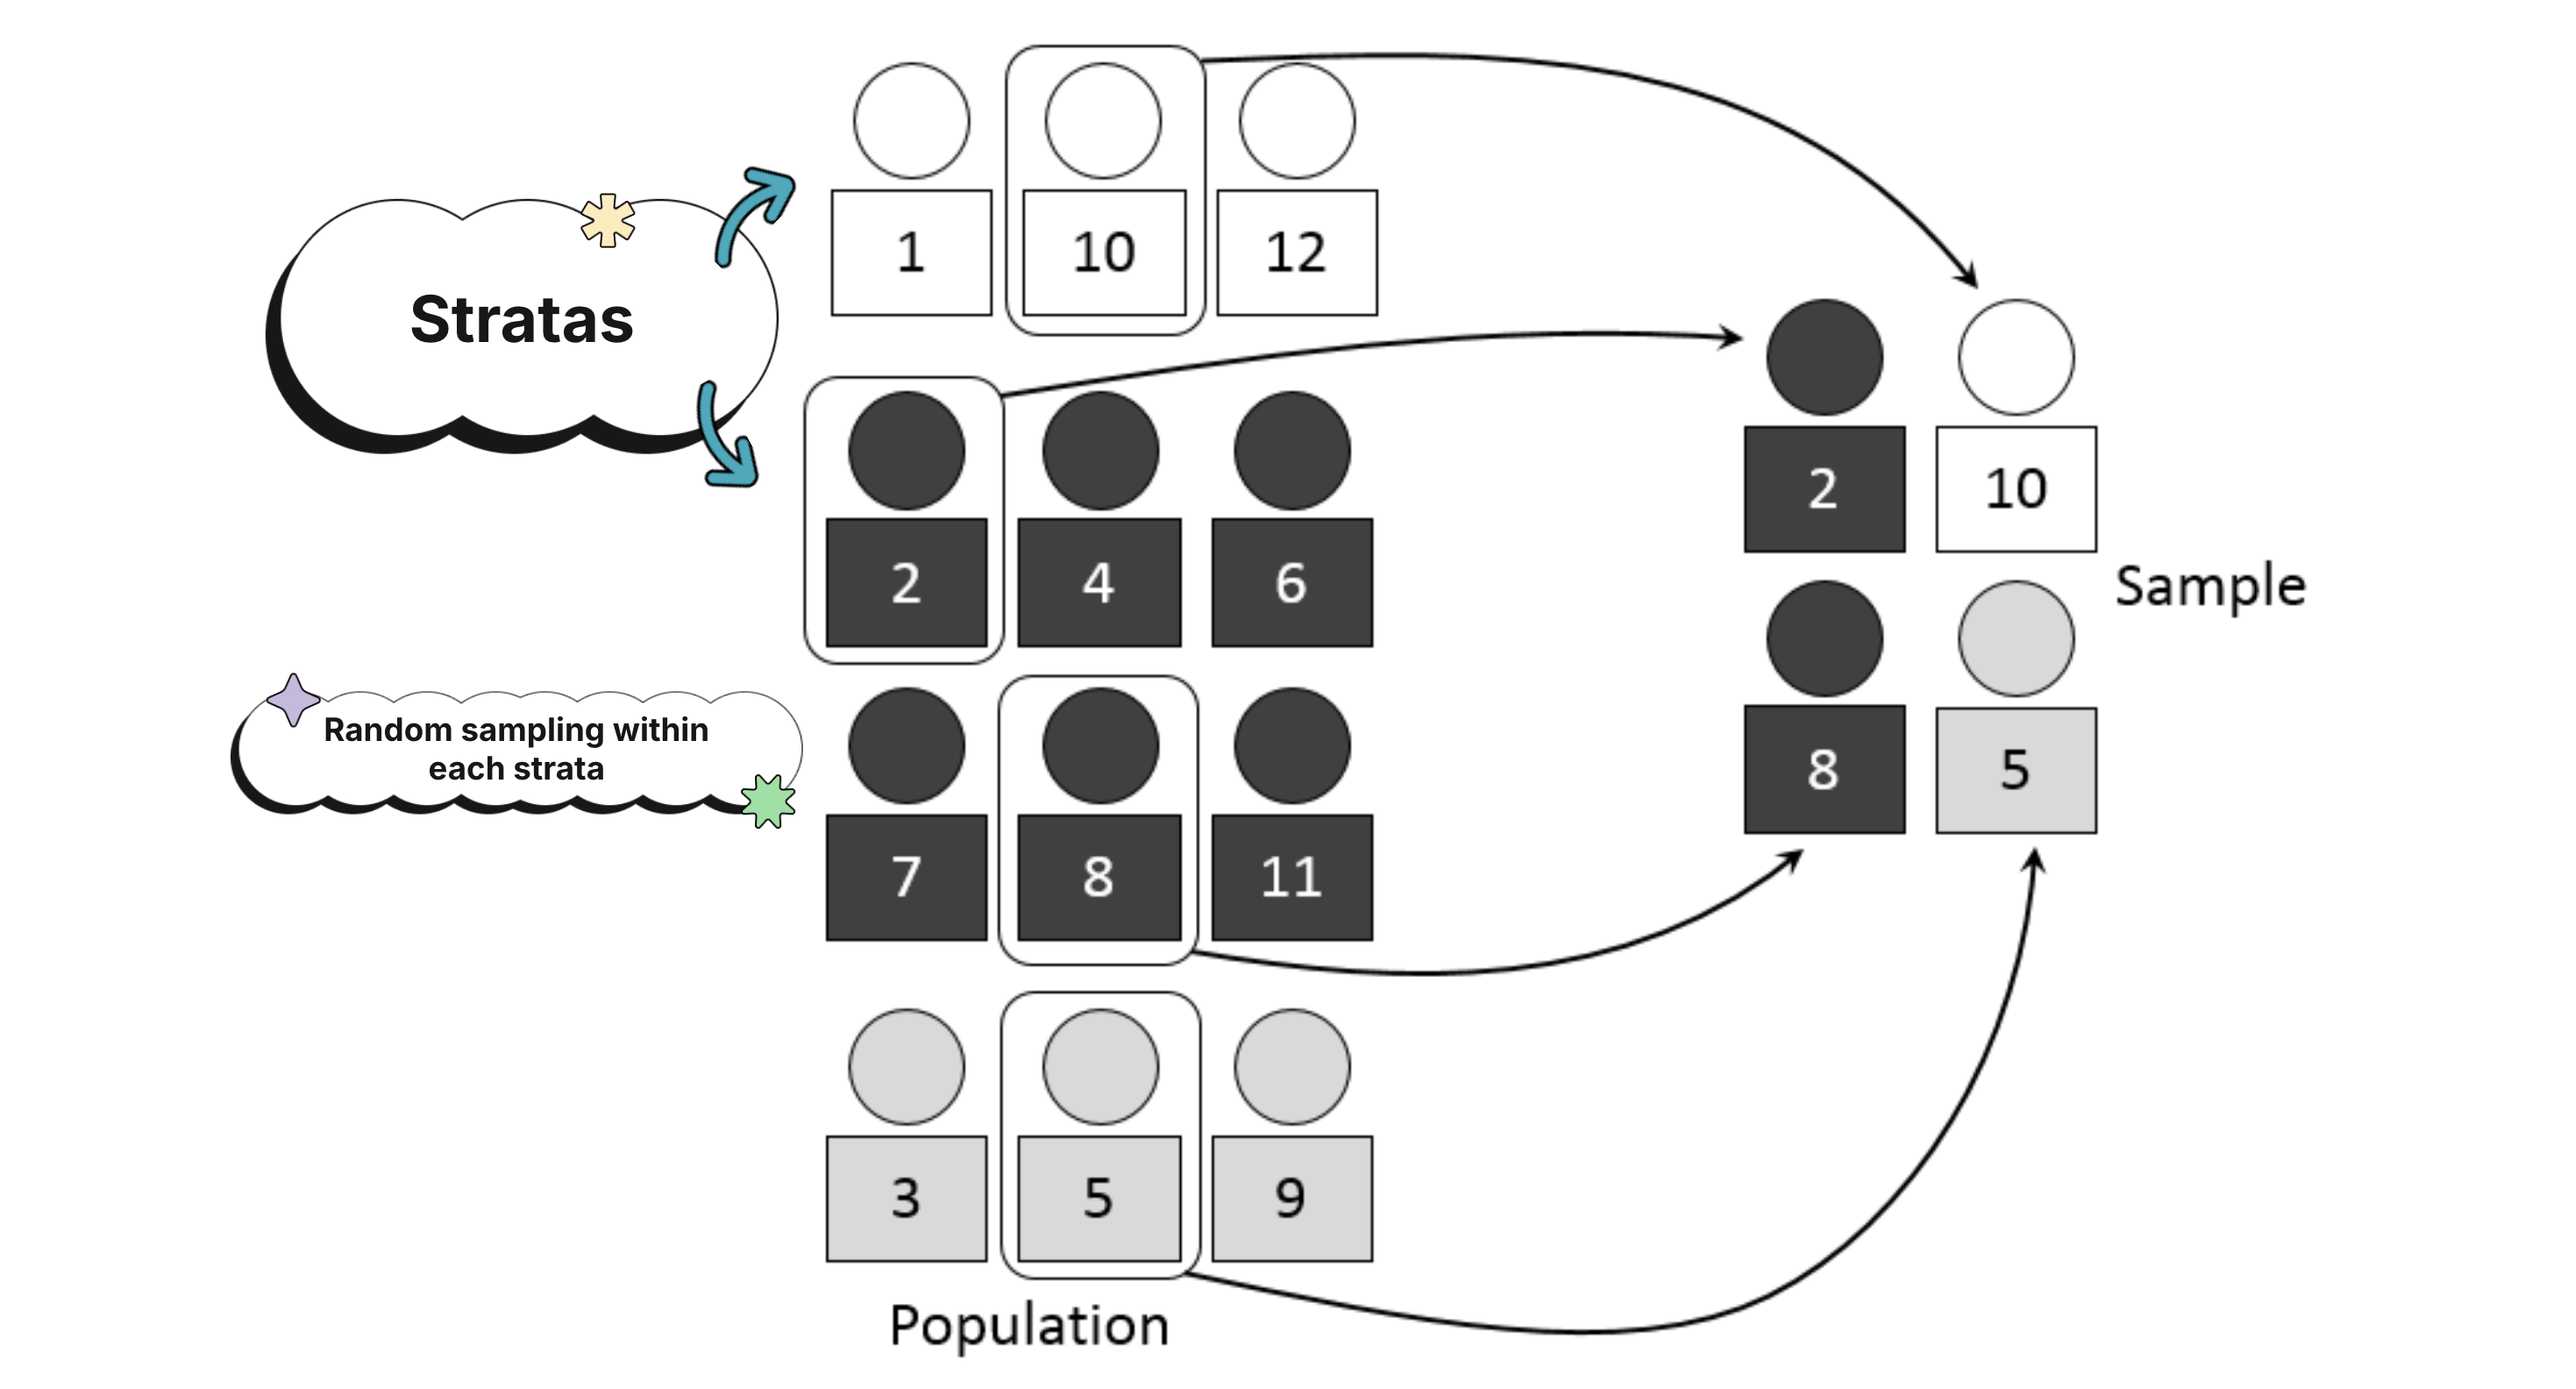
Strata are groups of individuals who share characteristics thought to be related to the variable being measured.
A stratified random sample divides the population into separate strata based on those shared characteristics. Within each stratum you take a simple random sample, then combine the selected units to form the final sample.
Stratified sampling is useful when the population is diverse with respect to the trait you care about. Because each stratum is made of similar individuals (homogeneous grouping), this approach can reduce variability and give more precise results.
Example
Suppose you study the relationship between diet and heart disease and want a sample that reflects the population's mix of age, gender, and income. You could form strata based on those traits, take an SRS within each stratum, and combine them. That way the sample mirrors the population on those characteristics.
Cluster Sample
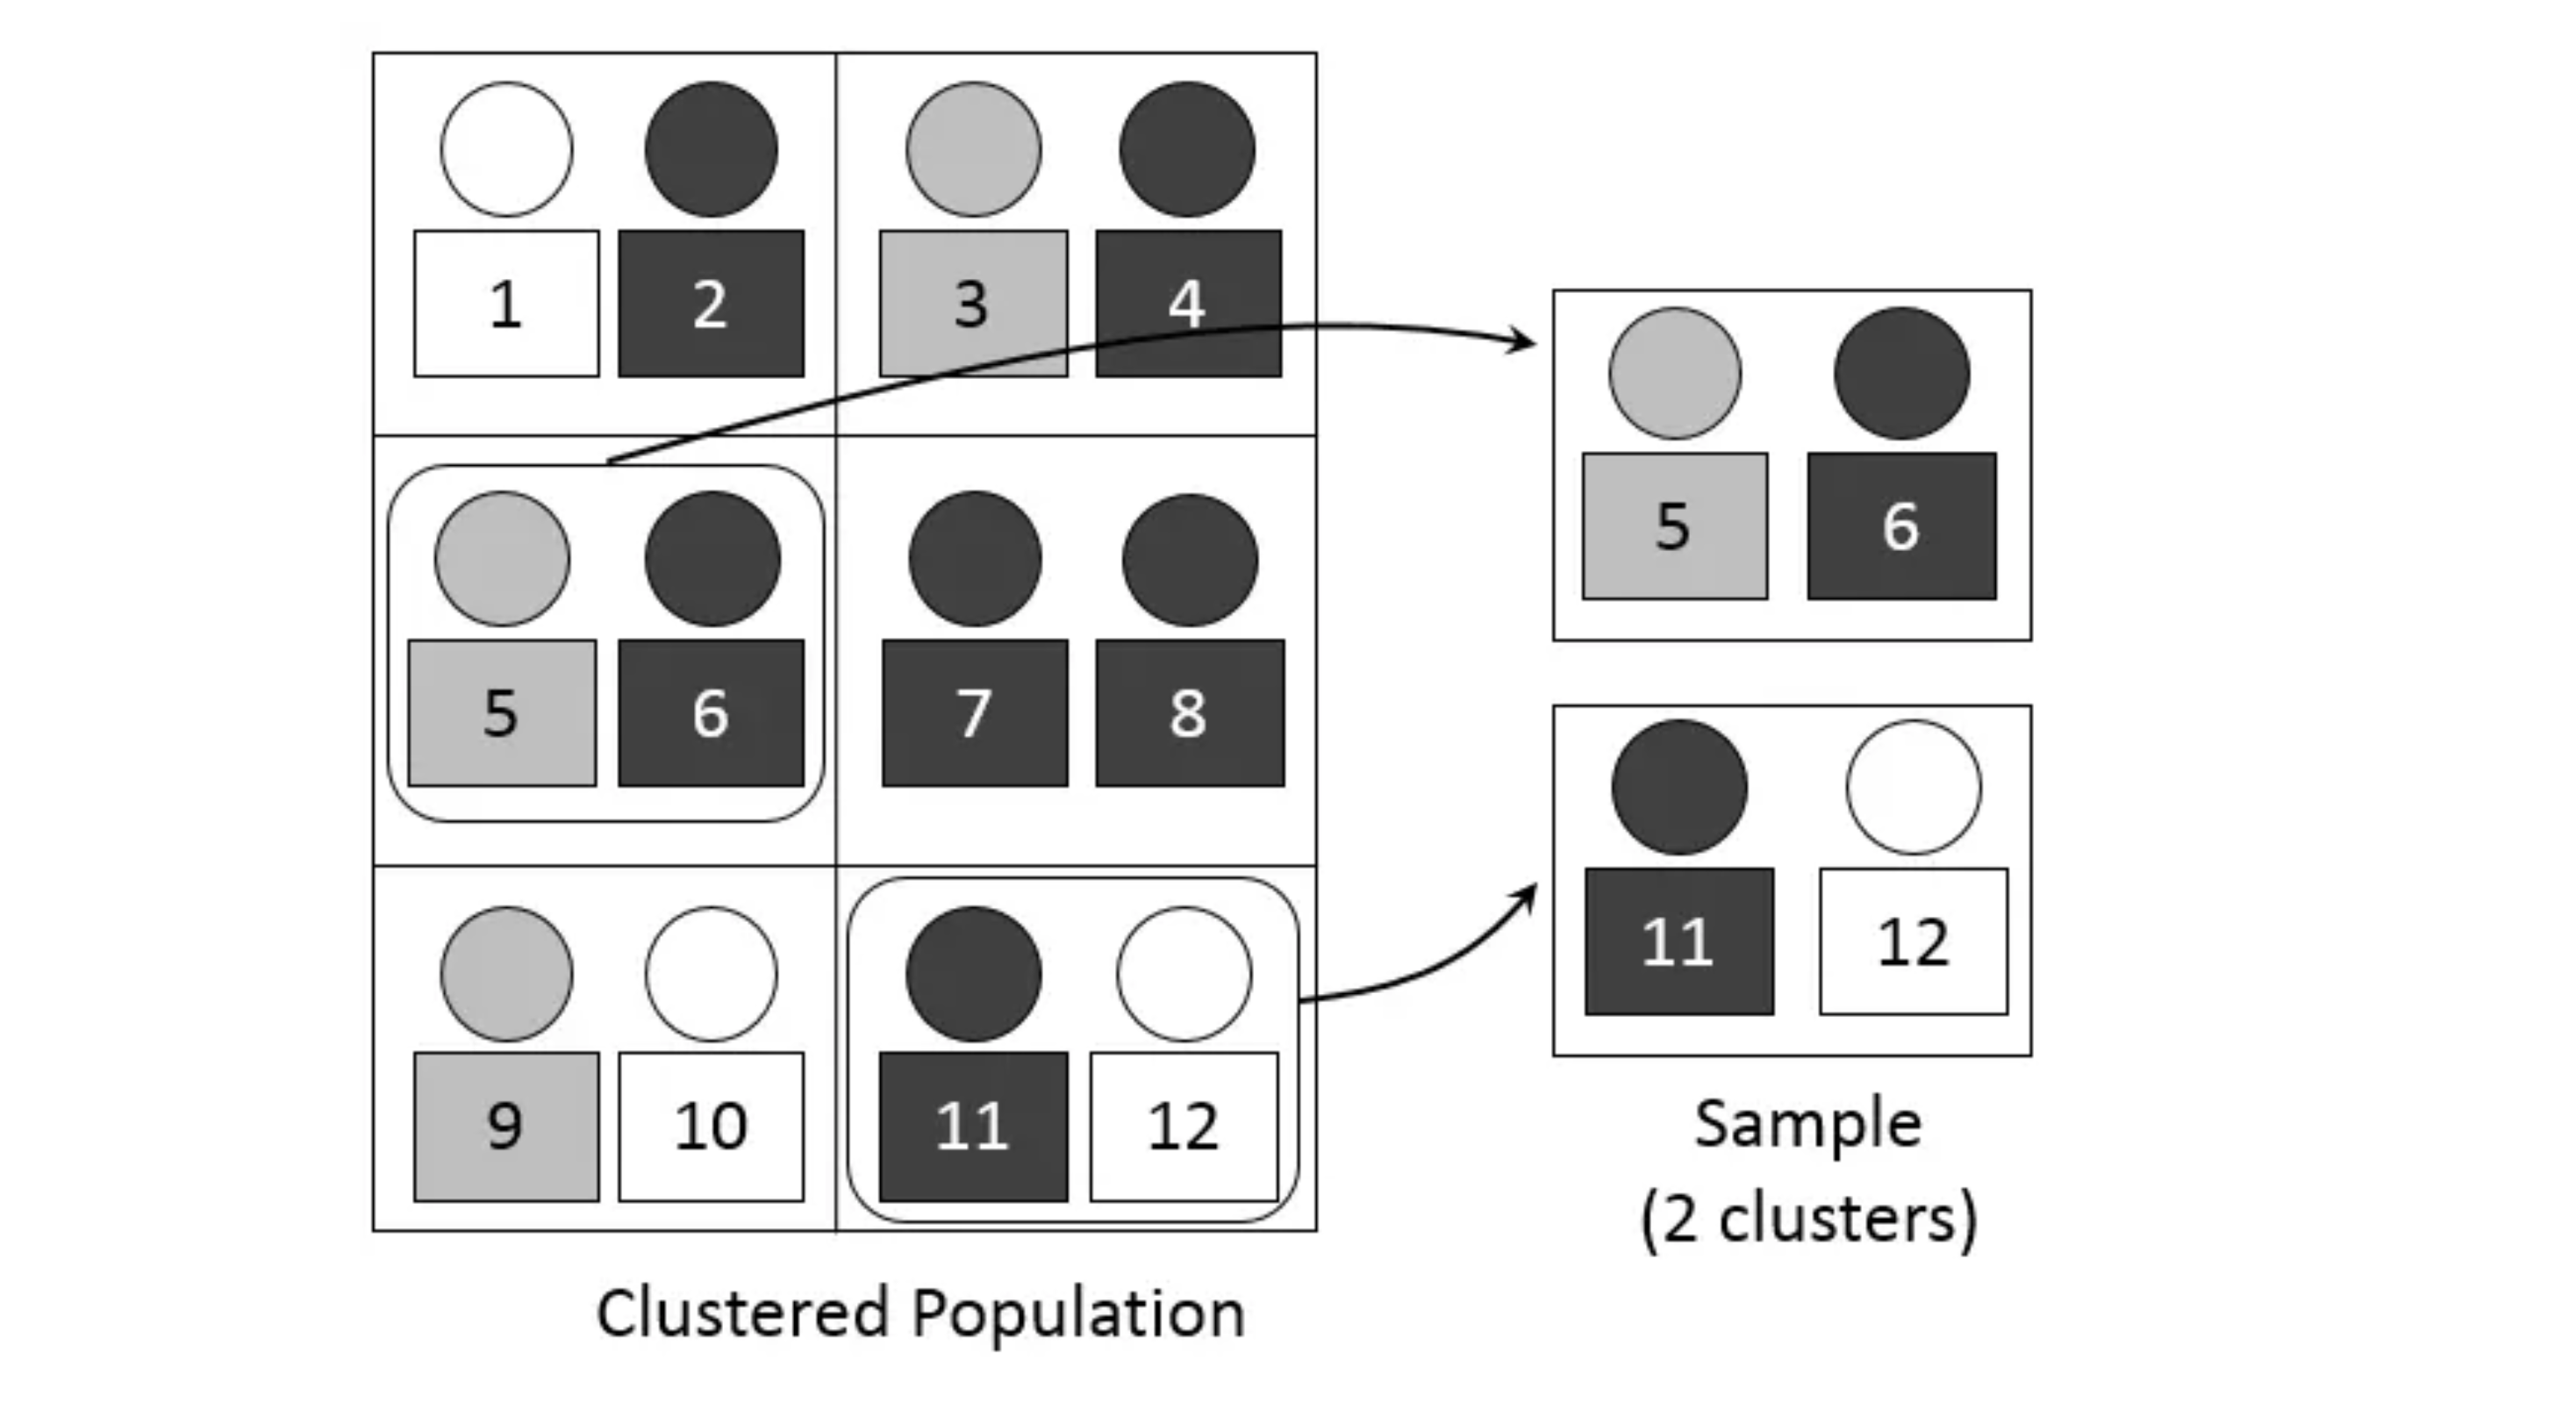
A cluster sample divides the population into smaller groups called clusters. Ideally there is heterogeneity within each cluster, and clusters resemble one another in composition. You take a simple random sample of clusters, then collect data from every observation in the selected clusters.
How is this different from stratified sampling? In stratified sampling you sample from every group. In cluster sampling you randomly pick whole groups and then survey everyone inside the chosen ones.
Cluster sampling can be more cost-effective and efficient than an SRS, especially when the population is spread out geographically or when a full list of individuals is hard to get. The risk is bias if the chosen clusters do not represent the overall population.
Example
Say you want to study high school students' attitudes toward school lunches in a large city. Instead of sampling students one by one from every school, you divide the schools into clusters by geographic region (north, south, east, west), randomly select some clusters, and then survey all students in those selected clusters. The population is all high school students in the city, the clusters are the regions, and the sample is everyone in the chosen regions.
Systematic Random Sample
A systematic random sample selects members using a random starting point and then a fixed, periodic interval. After picking a random start, you select every kth member from the list.
For example, with a list of 1000 people and a target sample of 100, you might pick a random start between 1 and 10, then take every 10th person (the 4th, 14th, 24th, and so on). The key is that the starting point is random.
Example
You want to study grocery store customers' attitudes toward a loyalty program. You build a list (sampling frame) of everyone who shopped in the past month, choose a random starting point, then select every 10th customer after it. The population is all customers from the past month, the sampling frame is the list, and the sample is the customers chosen by the interval.
Census
A census collects data from every item or subject in the population. It is not a sampling method in the usual sense because nothing is left out, but it is worth knowing as the complete-enumeration option.
How to Use This on the AP Statistics Exam
MCQ
Match the description to the method by focusing on how groups are formed and where the randomness happens:
- Picks individuals directly with equal chance for every group of that size: SRS.
- Splits into similar groups, then samples within each group: stratified.
- Splits into groups, randomly picks whole groups, surveys everyone inside: cluster.
- Random start, then every kth: systematic.
- Everyone is included: census.
A fast tell: stratified samples from all groups, cluster samples some groups and takes all members inside them.
Free Response
When asked to choose or evaluate a sampling method:
- Give a clear decision (which method and whether it is appropriate).
- Tie your reasoning to the population and the question being asked.
- Connect to the specific context, not just generic textbook advantages.
- Use "random selection" language, since this topic is about generalizing to a population. Save "random assignment" for experiment questions.
If asked to describe how to carry out a method, be specific: label the individuals, use a random process to choose, and explain what you do with the result.
Common Trap
There is often no single "correct" method. The trade-off between cost, precision, and how spread out the population is can make more than one method reasonable. Your justification is what matters, so explain why your choice fits the situation and acknowledge its downside.
Common Misconceptions
- Stratified and cluster sampling are not the same. Stratified groups are homogeneous and you sample from every group. Cluster groups are heterogeneous inside and you sample only some groups, then take everyone in them.
- "Random" does not mean "haphazard." A real random sample uses a defined chance process like a random number generator, not just picking whoever is convenient.
- A systematic sample is only random if the starting point is chosen randomly. Just taking every 10th person with no random start does not count.
- An SRS gives every group of a given size an equal chance, which is a stronger statement than just every individual having a chance. Some non-SRS methods still give individuals a chance but not every group.
- A census is not a sample. It includes the whole population, so there is no sampling involved.
- Random selection (who is in the sample) is different from random assignment (which treatment a unit gets). This topic is about selection and generalizing to a population.
Practice Problem
You want to study the attitudes of college students toward climate change across the United States. You have a budget of $10,000 and six months.
Three options:
- Simple random sampling: Build a list of all U.S. college students and use a random number generator to select them. Every student gets an equal chance, but building a complete list is expensive and slow.
- Cluster sampling: Divide students into clusters by geographic region (east coast, west coast, midwest), randomly select some clusters, and survey all students in those clusters. More efficient and cheaper, but biased if the chosen clusters do not represent the whole population.
- Systematic random sampling: Build a list, choose a random starting point, then select every 100th student. Easy to implement, but bias can creep in if the list has a hidden pattern matching the interval.
Which method is best, and why?
Answer
Cluster sampling is a strong choice here because it is efficient and cost-effective and does not require a full list of every U.S. college student. The catch is that you must argue the selected clusters are representative, or you risk bias.
That said, a well-supported case for SRS or systematic sampling can also earn credit. The graders care about your justification, so connect your choice to the budget, timeline, and population, and name the downside of the method you pick.
Related AP Statistics Guides
Vocabulary
The following words are mentioned explicitly in the AP® course framework for this topic.Term | Definition |
|---|---|
census | A data collection method that selects all items or subjects in a population. |
cluster | Concentrations of data usually separated by gaps in a distribution. |
cluster sample | A sampling method in which a population is divided into smaller groups called clusters, and a simple random sample of clusters is selected, with data collected from all observations in the selected clusters. |
population | The entire group of individuals or items from which a sample is drawn and about which conclusions are to be made. |
random number generator | A tool or method used to randomly select items from a population for inclusion in a simple random sample. |
sample | A subset of individuals or items selected from a population for the purpose of data collection and analysis. |
sampling method | A specific procedure or technique used to select a subset of individuals from a population for data collection and analysis. |
sampling with replacement | A sampling method in which an item selected from a population can be selected again in subsequent draws. |
sampling without replacement | A sampling method in which an item selected from a population cannot be selected again in subsequent draws. |
strata | Separate groups within a population created by dividing it based on shared attributes or characteristics for stratified sampling. |
stratified random sample | A sampling method in which a population is divided into separate groups called strata based on shared characteristics, and a simple random sample is selected from each stratum. |
systematic random sample | A sampling method in which sample members are selected from a population according to a random starting point and a fixed, periodic interval. |
Frequently Asked Questions
What are the main types of sampling in AP Statistics?
The main sampling methods in AP Statistics Topic 3.3 are simple random sample, stratified random sample, cluster sample, systematic random sample, and census. The exam usually asks you to identify the method from a description or explain why a method is appropriate for a population and question.
What is a simple random sample in AP Stats?
A simple random sample, or SRS, is a sample where every group of a given size has an equal chance of being chosen. A common AP Stats setup is to number every individual in the population and use a random number generator or table of random numbers to select the sample, ignoring repeats if sampling without replacement.
What is the difference between stratified and cluster sampling?
In stratified sampling, you split the population into similar groups called strata, take an SRS from each stratum, and combine the results. In cluster sampling, you split the population into clusters, randomly choose whole clusters, and collect data from everyone in the selected clusters. A quick AP Stats check: stratified samples from every group; cluster samples some groups.
What is systematic random sampling?
Systematic random sampling uses a random starting point and then selects every kth member from a list. The random start matters. If someone simply takes every 10th person without randomly choosing where to begin, the method is systematic but not properly random.
What is the difference between sampling with replacement and without replacement?
With replacement means a selected item goes back into the population and can be selected again. Without replacement means an item can be selected only once. Many survey samples are done without replacement, while replacement often appears in probability models and simulations.
How do I answer sampling method questions on the AP Statistics exam?
Identify where the randomness happens and how groups are handled. Ask whether individuals are chosen directly, every group is sampled, whole groups are selected, every kth member is used, or everyone is included. Then justify the method in context, using random selection language instead of random assignment language.