A confidence interval for a difference of population means estimates . To justify a claim, check whether 0 is inside the interval and explain the result in context.
If 0 is inside the interval, the data do not provide sufficient evidence that the population means differ. If 0 is outside the interval, the interval supports a claim that the means differ in the direction shown by the subtraction order.
Why This Matters for the AP Statistics Exam
This topic is a classic AP Statistics communication task. The exam expects you to reference the samples, name the populations, use the correct parameter order, and connect the interval to a claim without overstating what the data prove.
A statistical claim is a statement about a population parameter, such as a mean or proportion . With two populations, claims often concern the difference in parameters, such as versus .

Making a Conclusion
When given a confidence interval and making a conclusion, there is a preset template that we can use that helps us to be sure to include all of the vocabulary necessary to score well on the AP Statistics exam.
Template
Our template should go as follows:
- "Based on these samples, we are ___% confident that the true difference in population means (Group A − Group B) is from ___ to ___ (context of problem).
- "In repeated random sampling with the same sample size, approximately C% of confidence intervals created will capture the difference of population means (include context).
As with any AP Statistics Free Response question, it is always imperative that your answer includes context of the problem given. After all, a comprehensive interpretation for a confidence interval for the difference of two population means should include a reference to the samples taken and details about the populations they represent.
When testing for the difference in two populations, it is also important to use that interval to test the claim that the two population means differ. If 0 is included in your interval, we do not have sufficient evidence that the population means differ. If after completing your interval you do not have 0 in your interval, the results provide evidence that the population means differ in the direction indicated by the interval.
Finishing Our Apples to Apples Example
Let's finish our example with the green apples and red apples.
Suppose our confidence interval for the difference in mean apple weights was (0.408, 0.592), using green minus red as the subtraction order. Our conclusion should go as follows:
"Based on these samples of green apples (n1 = __) and red apples (n2 = __), we are 95% confident that the true difference in population mean weights (green − red) is between 0.408 and 0.592 units. Since 0 is not included in our interval, these data provide strong evidence that μ_green > μ_red (the population mean weight of green apples exceeds that of red apples)."
Notice that because 0 was not in our interval, the interval suggests a positive difference (green − red), which supports the conclusion above.
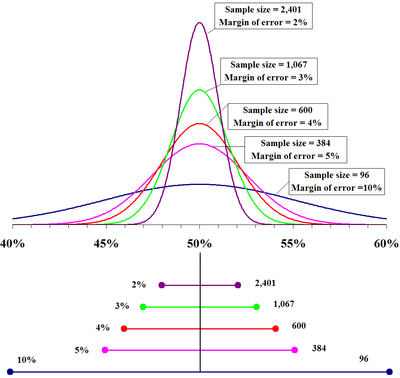
Relating Confidence Intervals and Sample Sizes
When all other things remain the same, the width of the confidence interval for the difference of two means tends to decrease as the sample sizes increase**.** That’s right: the margin of error is half the width of the interval. Margin of error = (critical value) × (standard error); interval width = 2 × margin of error. The margin of error decreases as sample sizes increase, approximately at a 1/√n rate. For two samples, SE = sqrt(s1^2/n1 + s2^2/n2); increasing n1 and/or n2 reduces SE and narrows the interval.
Recall that the confidence interval represents the range of values within which the true population parameter is likely to fall, with a certain level of confidence. In the case of the difference of two means, the confidence interval is calculated by taking the difference between the two sample means and adding and subtracting the margin of error. The margin of error is calculated based on the standard error of the difference between the means and the desired level of confidence.
Increasing the sample size allows for a more precise estimate of the population parameter, which results in a narrower confidence interval and a smaller margin of error.
Vocabulary
The following words are mentioned explicitly in the College Board Course and Exam Description for this topic.Term | Definition |
|---|---|
confidence interval | A range of values, calculated from sample data, that is likely to contain the true population parameter with a specified level of confidence. |
difference in sample means | The result of subtracting one sample mean from another sample mean, calculated as x̄₁ - x̄₂. |
difference of population means | The difference between the mean values of two distinct populations, calculated as μ₁ - μ₂. |
population means | The average values of two distinct populations being compared, denoted as μ₁ and μ₂. |
random sampling | A method of selecting samples from a population where each member has an equal chance of being chosen, ensuring the sample is representative of the population. |
sample size | The number of observations or data points collected in a sample, denoted as n. |
width of a confidence interval | The range or span of a confidence interval, calculated as the difference between the upper and lower bounds of the interval. |
Frequently Asked Questions
What is a confidence interval for a difference of means?
It is an interval estimate for μ1 - μ2, the difference between two population means. The interpretation depends on the order of subtraction.
How do you justify a claim about the difference of two means?
Use the confidence interval and check whether 0 is included. If 0 is outside the interval, the data support a claim that the population means differ in the interval direction.
What does it mean if 0 is in a confidence interval for μ1 - μ2?
If 0 is in the interval, the data do not provide sufficient evidence that the two population means are different at the matching significance level.
What should a two-mean confidence interval conclusion include?
Include the confidence level, both populations, the samples taken, the parameter order, the interval values, and a claim statement in context.
How does sample size affect a confidence interval for two means?
When everything else stays the same, larger sample sizes reduce standard error and make the confidence interval narrower.
How is a confidence interval for two means tested on AP Statistics?
You may interpret an interval, justify whether a claim is supported, identify the effect of sample size, or explain why context and subtraction order matter.