AP Statistics Unit 5 Cheatsheet: Regression Analysis

AP Statistics Unit 5 Cheatsheet: Regression Analysis

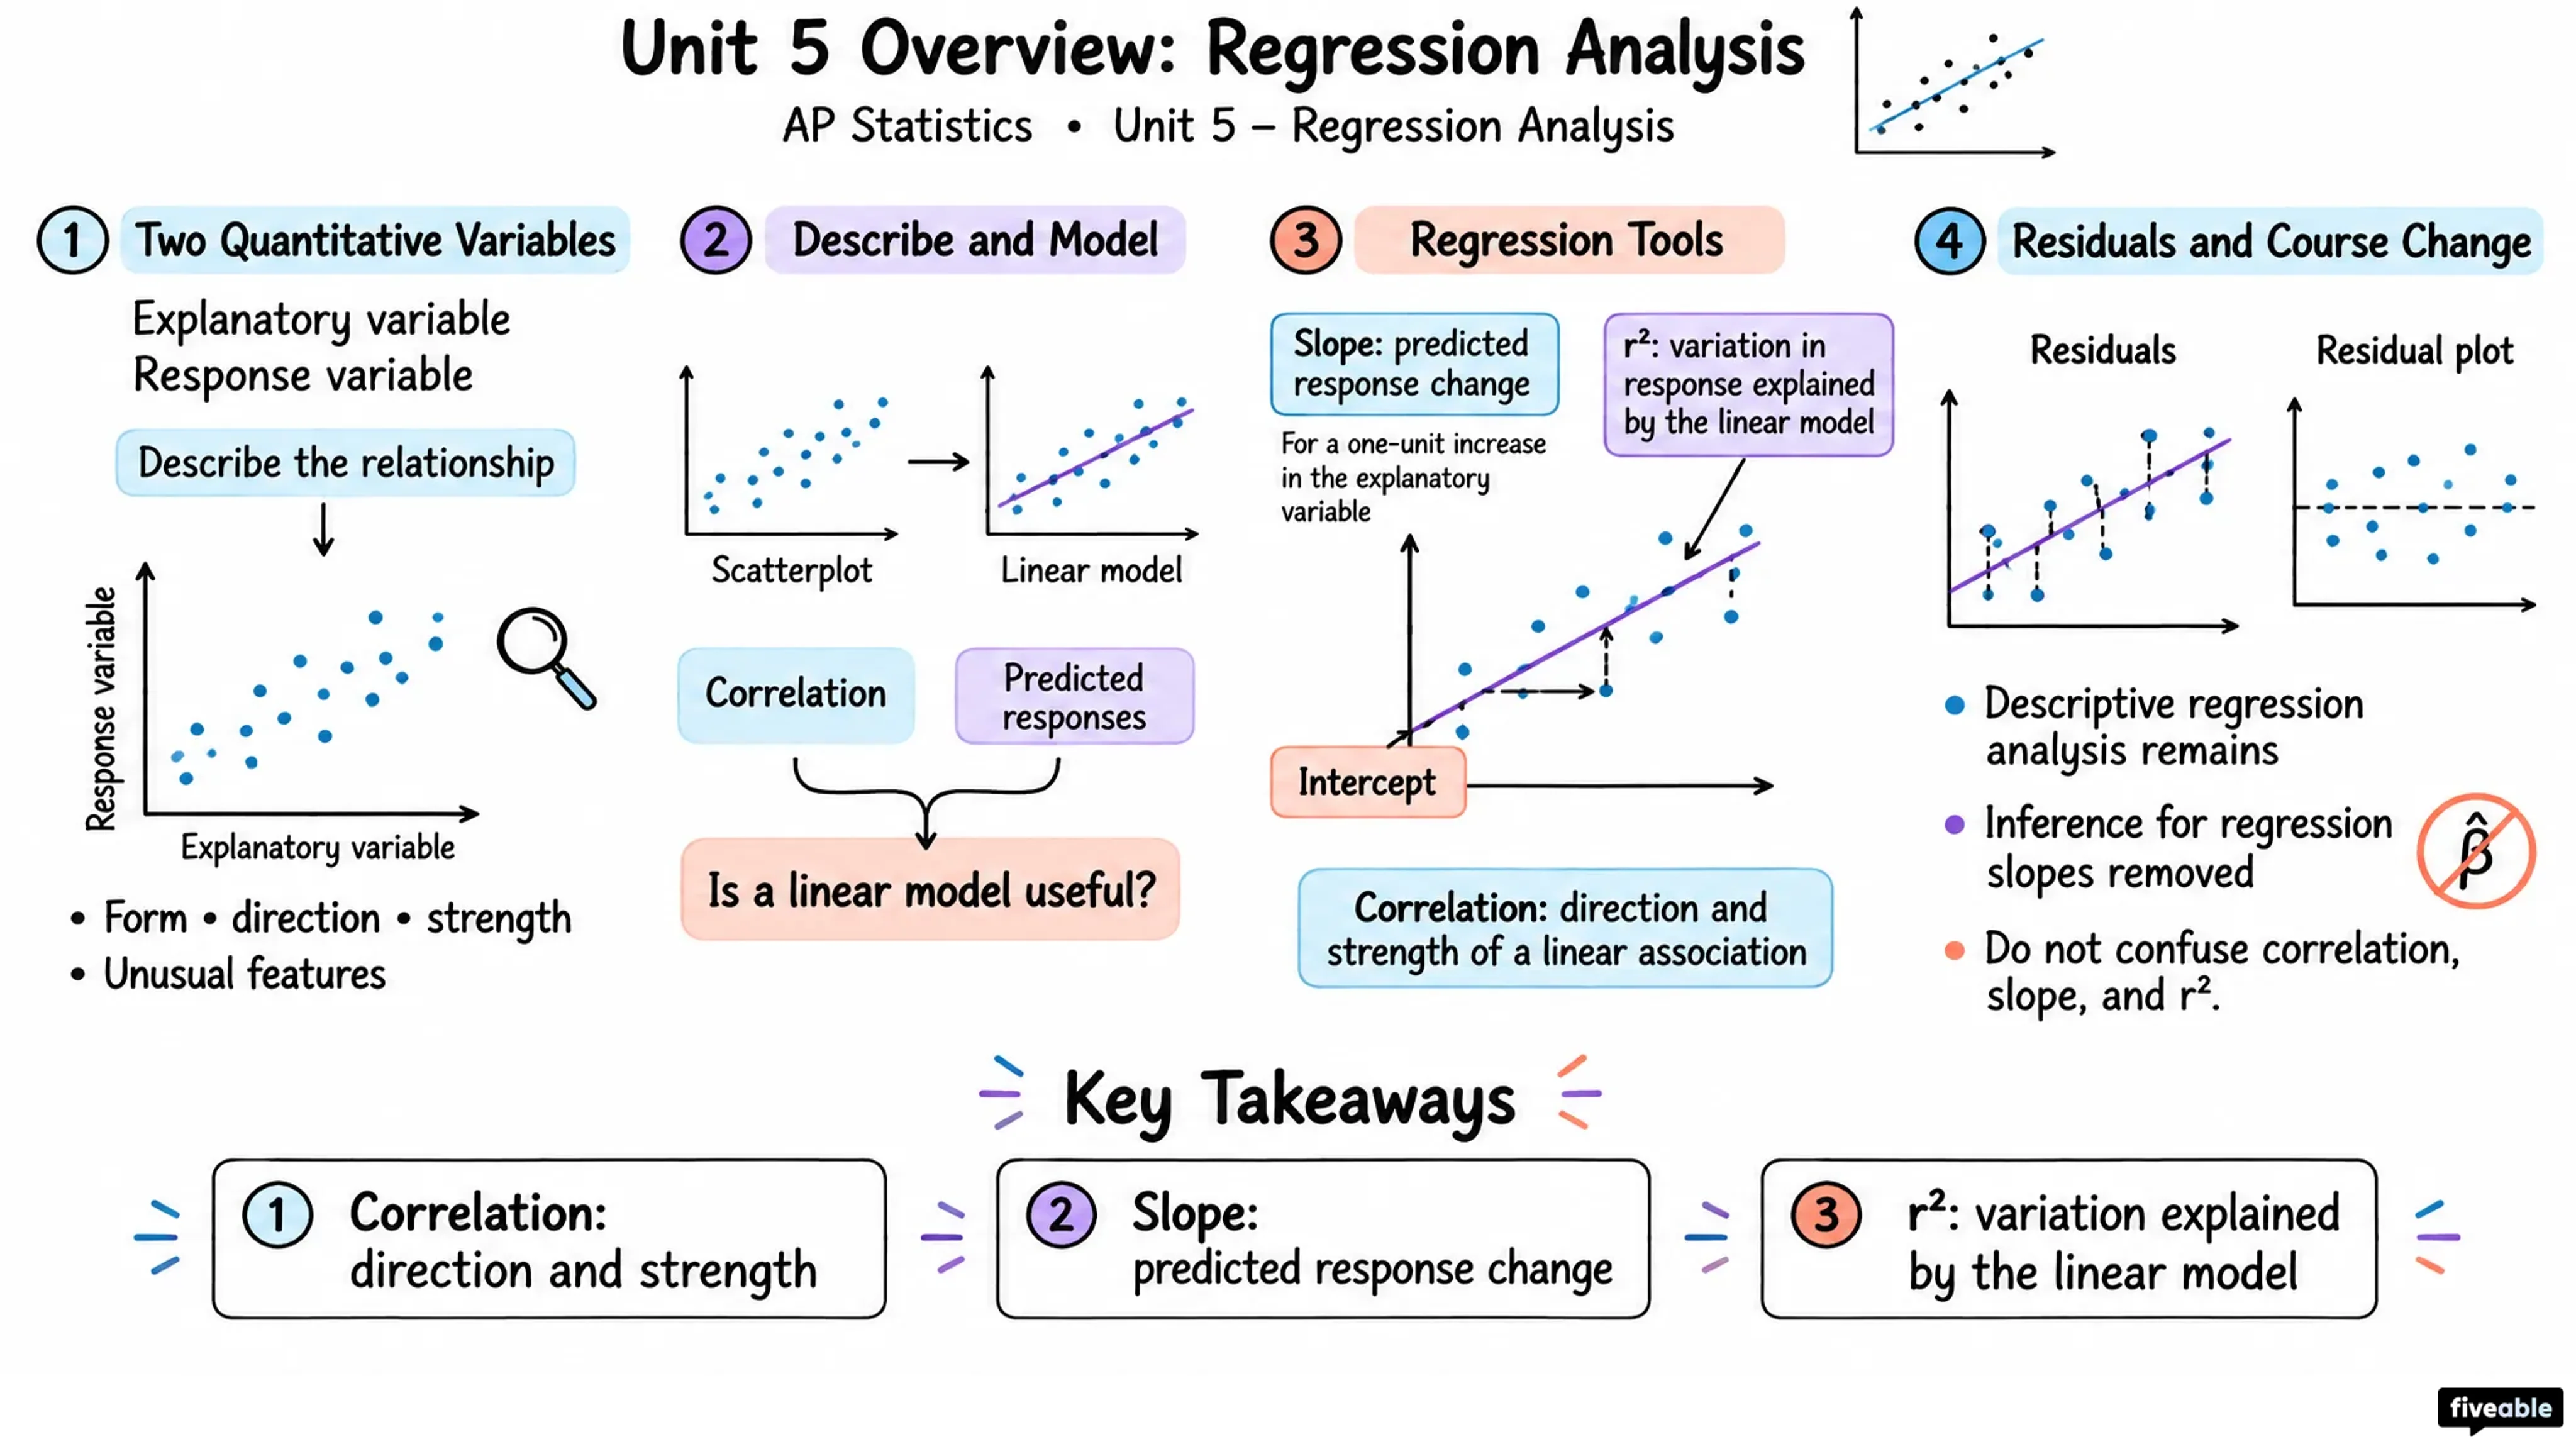
Start with the first 3 sections of the Unit 5 one-page cheatsheet below. The full sheet is a PDF you can print.

Scatterplot Setup & Description

Bivariate data: ordered pairs from two quantitative variables on the same individuals.

Axes: explanatory (x-axis) → response (y-axis).

Describe using:

  • Form: linear or non-linear
  • Direction: positive (↗) or negative (↘)
  • Strength: strong, moderate, or weak (how tightly clustered)
  • Unusual features: clusters, outliers, gaps

Use scatterplots to: reveal patterns and justify claims about relationships in context.
Solving Regression Questions: Step-by-Step

1. Identify variables: Which is explanatory (x)? Which is response (y)?

2. Examine scatterplot: Form, direction, strength, unusual features. Is linear reasonable?

3. Check correlation: r tells you strength/direction of linear association. But r ≠ appropriateness of model.

4. Use LSRL: ŷ = a + bx. Interpret slope and y-intercept in context.

5. Calculate residuals: residual = y − ŷ. Positive = underpredicts; negative = overpredicts.

6. Examine residual plot: Random scatter = linear OK. Curvature = linear not appropriate.

7. Report r²: Proportion of variation explained.

Common Traps & Interpretation Errors

Trap 1: High |r| means linear model is good. False. Always check residual plot.

Trap 2: Correlation implies causation. False. Correlation is association only.

Trap 3: Interpreting slope without units or context. Always include units and say "predicted."

Trap 4: Y-intercept is always meaningful. False. If x = 0 is outside data range or illogical, note that.

Trap 5: Extrapolating without warning. Always flag extrapolation as less reliable.

Trap 6: Confusing residual = y − ŷ with ŷ − y. Positive residual = underpredicts.

The rest of the Unit 5 sheet

6 more sections are on the one-page PDF:

  • Correlation Coefficient r

  • Linear Regression Model

  • Residuals & Residual Plots

  • Least-Squares Regression Line (LSRL)

  • Interpolation vs. Extrapolation

  • Quick Reference: Formulas & Notation

Made by you

Visual Cheatsheets

Pick a Unit 5 topic and a format: flowchart, comparison chart, vocab sheet, Cornell notes and more. Ready in about a minute.

Printable PDF · from the Fiveable shop

AP Statistics Unit 5 Cheatsheet

1 page · Regression Analysis · PDF

Visual Cheatsheets

One topic, the format you pick, ready in about a minute

Format

Topic

Takes 30–60 seconds

Preview: Standard

Unit 5: Regression Analysis, topic by topic

Each topic has a full study guide. See the whole unit.