A couple reminders from earlier sections:
- A confidence interval gives us a good prediction on what the slope of the true linear regression model for a population’s set of data by giving us a range of values to predict.
- The point estimate for the slope of a regression model is the slope of the line of best fit, b.
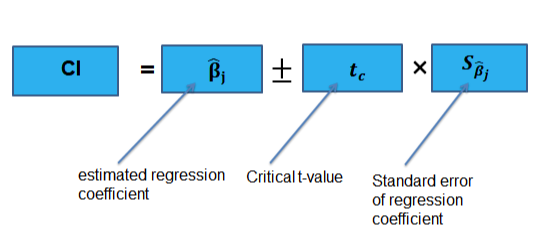
- For the slope of a regression model, the interval estimate is b + t (SE of b).*
In this section, we'll answer a burning question in this unit: how can we justify (or dispute) a claim about a linear regression model using this data?

Confidence Level
One of the important things about a confidence interval that we must set is the confidence level. Remember that this confidence level reflects the percentage of confidence intervals that would contain the true value we are aiming towards (in this case slope) if we were to take several unique samples of our given sample size.
For example, if we were to construct a 95% confidence interval to estimate the slope of a linear regression model, this means that if we were to create several random samples of the same size, from the same population, 95% of the resulting confidence intervals would contain the true slope of the population regression model.
Confidence Interval
A confidence interval is going to provide us with plausible values for our slope. For instance, if our confidence interval for the slope is (1.35, 2.7), we can be pretty certain that our correlation is positive and our slope is somewhere between 1.35 and 2.7.
Our interpretation of this would state something like: ➕
- We are 95% confident that the true slope of the regression line showing the correlation between variable A and variable B is somewhere between 1.35 and 2.7.
- In repeated random sampling with the same sample size, approximately 95% of confidence intervals created will capture the slope of the regression model, i.e., the true slope of the population regression model.
This is a very similar interpretation to what we used in Units 6 and 7, but altered to estimate the true slope instead of true mean or proportion.
Another thing worth noting is that the width of the confidence interval is going to decrease as the sample size increases. This is because an increased sample size decreases our standard error. Also, as the confidence level increases, the width of our interval will increase.
Justifying a Claim
If we are seeking to justify a claim about correlation with our confidence interval for slopes, we should be seeking to determine if 0 is contained in our interval.
If 0 is contained in our confidence interval, it is definitely plausible that 0 is the slope of our least squares regression model. If 0 is the slope, there essentially is no linear correlation.
For example, if we use our interval from the previous example (1.35, 2.7), this tells us that the two variables of interest ARE correlated because there 0 is not contained in our interval so we can be 95% confident (or whatever confidence level) that our slope is positive and our variables have a positive correlation of some sort.
Example
The most likely type of question you would see on linear regression on the AP exam would involve a computer output. Using a computer output, we'll interpret what our confidence interval would look like. We also need a sample size to compute our t score, so let’s assume our sample size is 40 for our scatterplot and a 95% confidence level.
First, we would need to compute our t score by doing invT based on 38 degrees of freedom (n - 2). The other aspects of our confidence interval are already in our problem. Our t-score for a 95% confidence interval comes out to be 2.02.
Our confidence interval would be 0.4482.02(0.6565), which is the slope estimate plus/minus (t score)(standard deviation/error). Be careful not to use the t score given in the table. That is the t score for our sample not for the desired confidence interval.
This would yield a final example of (-0.87813, 1.77413). Since 0 is contained in this interval, we do not have evidence that there is a linear correlation (which is also evident by the low R2 value and subsequent low r value (0.176).
Vocabulary
The following words are mentioned explicitly in the College Board Course and Exam Description for this topic.
| Term | Definition |
|---|---|
| confidence interval | A range of values, calculated from sample data, that is likely to contain the true population parameter with a specified level of confidence. |
| population regression model | The true regression model for an entire population, as opposed to a sample-based regression model. |
| regression model | A statistical model that describes the relationship between a response variable (y) and one or more explanatory variables (x). |
| repeated random sampling | The process of taking multiple random samples from a population, each of the same size, to understand the variability of sample statistics. |
| sample | A subset of individuals or items selected from a population for the purpose of data collection and analysis. |
| sample size | The number of observations or data points collected in a sample, denoted as n. |
| slope | The value b in the regression equation ŷ = a + bx, representing the rate of change in the predicted response for each unit increase in the explanatory variable. |
| slope of a regression model | The coefficient that represents the rate of change in the predicted response variable for each unit increase in the explanatory variable in a linear regression equation. |
| width of a confidence interval | The range or span of a confidence interval, calculated as the difference between the upper and lower bounds of the interval. |
Frequently Asked Questions
How do I interpret a confidence interval for the slope of a regression line?
A confidence interval for the slope (b1) gives a range of plausible values for the true population slope (β1). Interpret it like this: “Based on the random sample of [context/population], we are C% confident that the true change in the mean response for a one-unit increase in x is between ___ and ___ (units).” By UNC-4.AG.1, C% of such intervals from repeated samples would capture β1. To justify a claim about the slope, check whether the interval supports it: if the CI does not contain 0, you have evidence of a linear association (sign ≠ 0); if it contains 0, the data don’t provide convincing evidence of a nonzero slope (UNC-4.AH.1). Remember to state the sample and population (UNC-4.AG.2). Larger n (other things equal) narrows the CI because the standard error of b1 decreases (UNC-4.AI.1). For more examples and AP-style practice, see the Topic 9.3 study guide (https://library.fiveable.me/ap-statistics/unit-9/justifying-claim-about-slope-regression-model-based-on-confidence-interval/study-guide/RZiwGnIkfD5Y67n7rVrY) and practice problems (https://library.fiveable.me/practice/ap-statistics).
What's the formula for finding a confidence interval for regression slope?
Confidence interval for the slope β1 of a regression: b1 ± t* · SE(b1), where - b1 = sample slope, - t* = t critical value with df = n − 2 for your chosen confidence level, - SE(b1) = s / (s_x · sqrt(n − 1)) (equivalently s / sqrt(Σ(xi − x̄)²)), with s = √[Σ(yi − ŷi)²/(n − 2)] and s_x = sample SD of x. So compute b1 from least-squares, compute s (residual standard error), get SE(b1), look up t* for df = n − 2, and form b1 ± t*·SE(b1). Remember AP exam rules: use the t-distribution (df = n − 2) and check regression conditions—linearity, independence/random sampling or random assignment, equal variance (homoscedasticity), and roughly normal residuals—before trusting the CI. The formula is on the AP formula sheet; for a guided review see the Topic 9.3 study guide (https://library.fiveable.me/ap-statistics/unit-9/justifying-claim-about-slope-regression-model-based-on-confidence-interval/study-guide/RZiwGnIkfD5Y67n7rVrY) and more unit review (https://library.fiveable.me/ap-statistics/unit-9). For extra practice, try problems at (https://library.fiveable.me/practice/ap-statistics).
When do I use a confidence interval vs hypothesis test for regression slope?
Use a confidence interval when you want a range of plausible values for the population slope β1 (estimate and uncertainty). Use a hypothesis test when you need a formal yes/no decision about a specific value (usually H0: β1 = 0) and a p-value. Practical rules for AP Stats (Topic 9.3 / 9.4–9.5): - CI: compute b1 ± t*·SE(b1) with df = n−2. If the entire CI is above (or below) 0, that provides evidence the slope ≠ 0 and can justify a claim about direction and size. UNC-4.AG and UNC-4.AH focus on interpreting and justifying claims from CIs. - Hypothesis test: compute t = (b1 − β0)/SE(b1) and compare p-value to α to decide. Use this when the question asks “Is there evidence that…” or “test whether…”. Both methods use the t-distribution (df = n−2) and require regression conditions (linearity, residuals ~ normal for each x, equal variance, independence). Larger n shrinks CI width (UNC-4.AI). For AP practice and worked examples see the Topic 9.3 study guide (https://library.fiveable.me/ap-statistics/unit-9/justifying-claim-about-slope-regression-model-based-on-confidence-interval/study-guide/RZiwGnIkfD5Y67n7rVrY), the Unit 9 overview (https://library.fiveable.me/ap-statistics/unit-9), and practice problems (https://library.fiveable.me/practice/ap-statistics).
Can someone explain step by step how to justify a claim using a confidence interval for slope?
Step-by-step: 1. State the CI and claim in context (e.g., “A 95% CI for β1 is (0.8, 2.4). Claim: slope > 0 → positive association between x and y for the population.”). 2. Check whether the interval includes 0. If 0 is NOT in the CI, the interval gives evidence the population slope β1 differs from 0. If the entire CI is above 0, it supports a positive slope; if entirely below 0, it supports a negative slope. If CI contains 0, the data don’t provide sufficient evidence for an association. 3. Tie to confidence level: “At the 95% confidence level, we are reasonably sure that the true slope lies between 0.8 and 2.4, so the data support the claim of a positive slope.” (CED UNC-4.AG/4.AH). 4. Mention mechanics briefly: CI = b1 ± t*(SEb1) with df = n−2. 5. Verify conditions: random/independent sample, linearity, equal variance (homoscedasticity), nearly normal residuals. Also note larger n narrows the CI (UNC-4.AI). For a quick refresher, see the Fiveable study guide for this topic (https://library.fiveable.me/ap-statistics/unit-9/justifying-claim-about-slope-regression-model-based-on-confidence-interval/study-guide/RZiwGnIkfD5Y67n7rVrY) and try practice problems (https://library.fiveable.me/practice/ap-statistics).
I'm confused about what it means when they say "C% of confidence intervals will capture the true slope" - can someone explain this?
When they say “C% of confidence intervals will capture the true slope,” they mean this as a long-run statement about repeated random sampling. If you repeatedly take samples of the same size from the population and build a C% confidence interval for the population slope β1 each time, about C% of those intervals will contain the true slope. Your one interval either does or doesn’t contain β1, but the procedure has that long-run success rate. When you interpret an interval on the exam, mention the sample and the population (CED UNC-4.AG.2). Example: “A 95% CI from a random sample of n college students suggests that, in repeated samples of this size from the population of college students, about 95% of such intervals would capture the true slope β1.” Also remember conditions (linearity, equal variance, independence, normal residuals) and that larger n narrows the CI (UNC-4.AI.1). For a focused review, see the Topic 9.3 study guide (https://library.fiveable.me/ap-statistics/unit-9/justifying-claim-about-slope-regression-model-based-on-confidence-interval/study-guide/RZiwGnIkfD5Y67n7rVrY) and try practice problems (https://library.fiveable.me/practice/ap-statistics).
How do I know if my confidence interval provides enough evidence to support a claim about the slope?
Check what the confidence interval for the slope (β1) contains and interpret it in context. Rules you’ll use on the AP: - If the CI does NOT contain 0, you have evidence the slope is different from 0 (supports a claim of a nonzero linear association). - If the entire CI is above 0, that supports a positive slope claim; if the entire CI is below 0, that supports a negative slope claim. - If the CI includes 0, the interval does not provide convincing evidence the slope differs from 0. Always state the conclusion in context, refer to the sample and the population (UNC-4.AG.2), and compare to the claim (UNC-4.AH.1). Also verify conditions for inference (linearity, normal residuals, equal variance, random sample) and that df = n − 2 was used to get t*. Remember larger n → narrower CI (UNC-4.AI.1) because SEb = s/(sx√(n−1)). For a quick refresher see the Topic 9.3 study guide (https://library.fiveable.me/ap-statistics/unit-9/justifying-claim-about-slope-regression-model-based-on-confidence-interval/study-guide/RZiwGnIkfD5Y67n7rVrY) and more practice at (https://library.fiveable.me/practice/ap-statistics).
What's the difference between the sample slope and the population slope in regression?
The sample slope (b1) is the estimate you get from your data—the slope of the least-squares line fit to your sample. The population slope (β1) is the true, but usually unknown, rate of change in the population regression model. In AP terms b1 is a statistic; β1 is a parameter. Because of sampling variability b1 will vary from sample to sample; a confidence interval (b1 ± t*SEb) gives a range of plausible values for β1 and, in repeated random sampling, about C% of those intervals will capture the true β1 (UNC-4.AG.1). Remember the CI uses the t-distribution with df = n − 2 and SEb = s / (sx√(n − 1)). Larger n shrinks SEb and narrows the CI (UNC-4.AI.1), giving more precise estimates of β1. For quick review see the Fiveable Topic 9.3 study guide (https://library.fiveable.me/ap-statistics/unit-9/justifying-claim-about-slope-regression-model-based-on-confidence-interval/study-guide/RZiwGnIkfD5Y67n7rVrY) and try practice problems (https://library.fiveable.me/practice/ap-statistics).
How does sample size affect the width of a confidence interval for regression slope?
Bigger samples give you tighter (narrower) confidence intervals for the slope, all else equal. The CI for the slope is b1 ± t*·SE(b1). SE(b1) depends on the residual variability and the spread of x and shrinks roughly like 1/√n (for example, σ_b ≈ σ / (σ_x √n)), so increasing n reduces the standard error. At the same time the t* critical value gets smaller as degrees of freedom increase (it approaches the z value), which also shortens the interval. So larger n → smaller SE and smaller t* → narrower CI, making it easier to show the interval excludes 0 (supporting a claim about a nonzero slope). Remember to always interpret the interval in context and cite the sample and population (UNC-4.AG, UNC-4.AI). For a focused review, see the Topic 9.3 study guide (https://library.fiveable.me/ap-statistics/unit-9/justifying-claim-about-slope-regression-model-based-on-confidence-interval/study-guide/RZiwGnIkfD5Y67n7rVrY) and more practice problems at (https://library.fiveable.me/practice/ap-statistics).
I don't understand how to write the interpretation for a confidence interval for slope - what do I need to include?
Write three parts in your CI-for-slope sentence: what you measured (sample & population), the actual interval with units, and what it means about the relationship (including the confidence level and repeated-sampling idea). Example structure you can copy: - “Based on a random sample of n = ___ (describe subjects), a 95% CI for the population slope β1 is (L, U) (units: change in y per 1 unit of x).” - “This means we are 95% confident that for the population of [context], the true slope is between L and U—in repeated sampling, about 95% of such intervals will capture β1 (CED UNC-4.AG).” - Then justify the claim: “Because the interval does not include 0, there is evidence of a linear association (slope ≠ 0). If the interval includes 0, the data do not provide sufficient evidence of a nonzero slope (CED UNC-4.AH).” Also mention any conditions or assumptions you checked (linearity, equal variance, near-normal residuals) and note that larger n would narrow the interval (UNC-4.AI). For more examples, see the Topic 9.3 study guide (https://library.fiveable.me/ap-statistics/unit-9/justifying-claim-about-slope-regression-model-based-on-confidence-interval/study-guide/RZiwGnIkfD5Y67n7rVrY) and Unit 9 overview (https://library.fiveable.me/ap-statistics/unit-9). Practice more with problems at (https://library.fiveable.me/practice/ap-statistics).
When the confidence interval for slope contains zero, what does that mean for my claim?
If a confidence interval for the slope (β1) contains 0, it means 0 is a plausible value for the population slope given your sample—so you do NOT have sufficient evidence, at that confidence level, to claim a nonzero linear relationship. In AP terms: the CI gives plausible values for β1 (UNC-4.AG / UNC-4.AH); if 0 lies inside the interval you can’t justify a claim that the slope differs from 0. This is equivalent to failing to reject H0: β1 = 0 in a hypothesis test at α = 1 − C. Before you conclude, check regression conditions (linearity, normal residuals, constant variance, random sample) and consider sample size: larger n makes the CI narrower (UNC-4.AI). For a quick refresher on interpreting CIs for slope see the Topic 9.3 study guide (https://library.fiveable.me/ap-statistics/unit-9/justifying-claim-about-slope-regression-model-based-on-confidence-interval/study-guide/RZiwGnIkfD5Y67n7rVrY). Want practice? Try problems at (https://library.fiveable.me/practice/ap-statistics).
How do I solve a problem where I need to justify whether there's a linear relationship using a confidence interval?
Look at the confidence interval for the slope (b1). If the interval does not contain 0, the data provide evidence of a linear relationship between x and y (because a slope of 0 means no linear association). If 0 is inside the interval, the data do not provide strong evidence of a nonzero linear relationship. When you write the justification for the AP exam: - State the interval, the confidence level (C%), and that the interval estimates the population slope β1 (UNC-4.AG). - Conclude in context: e.g., “Because the C% CI for β1 is (L, U) and 0 is not in this interval, there is convincing evidence of a linear association between [x context] and [y context].” - Mention conditions: linearity, independence/random sample, roughly normal residuals, and equal variance (UNC-4.AH). - Optional: note sample size effect—larger n → smaller SE and narrower CI (UNC-4.AI). For a refresher, see the Topic 9.3 study guide (https://library.fiveable.me/ap-statistics/unit-9/justifying-claim-about-slope-regression-model-based-on-confidence-interval/study-guide/RZiwGnIkfD5Y67n7rVrY), the Unit 9 overview (https://library.fiveable.me/ap-statistics/unit-9), and practice problems (https://library.fiveable.me/practice/ap-statistics).
What happens to my confidence interval if I increase my sample size from 20 to 100?
If you increase n from 20 to 100 (keeping everything else the same), your confidence interval for the slope will get noticeably narrower. The standard error of the slope is proportional to 1/√(n−1), so the margin of error shrinks by about √(20/100) = √0.2 ≈ 0.45—roughly 45% of the original width. Also, the t* critical value gets a bit smaller because your degrees of freedom increase (so your margin of error drops a little more). Together that means a much tighter interval around b1, so you’ll have more precise estimates of β1 and stronger ability to justify a claim about the slope (assuming linearity, equal variance, normal residuals, and random sampling still hold). For more AP-aligned review of CIs for slopes and practice, see the Topic 9.3 study guide (https://library.fiveable.me/ap-statistics/unit-9/justifying-claim-about-slope-regression-model-based-on-confidence-interval/study-guide/RZiwGnIkfD5Y67n7rVrY) and the Unit 9 overview (https://library.fiveable.me/ap-statistics/unit-9). For extra practice try the AP problems (https://library.fiveable.me/practice/ap-statistics).
I missed class - can someone explain what "sufficient evidence to support a claim" means with confidence intervals?
"Sufficient evidence to support a claim" means the confidence interval for the slope gives plausible values for the population slope (β1) that line up with the claim. Practically: compute a CI for the slope (b1 ± t*·SEb). If the entire interval lies on one side of 0, you have evidence that the true slope is positive or negative—so the data provide sufficient evidence for a directional claim. If the interval contains 0, the data do NOT provide sufficient evidence to support a claim of a nonzero relationship. Be sure your interpretation mentions the sample and the population (UNC-4.AG.2): e.g., “Based on this random sample of n students, a 95% CI for β1 is (0.5, 2.3). In repeated sampling, ~95% of such intervals would contain the true slope, and because 0 is not in the interval, there is sufficient evidence that the population slope is positive (UNC-4.AH).” Remember larger n narrows the CI, making it easier to get sufficient evidence (UNC-4.AI). For the AP topic guide and extra practice see the Topic 9.3 study guide (https://library.fiveable.me/ap-statistics/unit-9/justifying-claim-about-slope-regression-model-based-on-confidence-interval/study-guide/RZiwGnIkfD5Y67n7rVrY), the Unit 9 overview (https://library.fiveable.me/ap-statistics/unit-9), and 1000+ practice problems (https://library.fiveable.me/practice/ap-statistics).
How do I know what population my confidence interval represents when interpreting regression slope?
The confidence interval for the slope always refers to the population that your sample represents—not just the sample itself. So when you interpret a CI for the slope, name the sample and the larger population it was drawn from and state the parameter is the population slope (β1). Example: “Based on a random sample of 60 high school seniors, a 95% CI for the slope is (−0.12, −0.02). We are 95% confident the true slope β1 for all high school seniors in this district is between −0.12 and −0.02.” Also mention the CED idea that in repeated random sampling about C% of such intervals will capture the true population slope (UNC-4.AG.1), and check conditions (linearity, equal variance, random sample). Larger n shrinks the CI (UNC-4.AI.1). For more examples and wording to use on the exam, see the topic study guide (https://library.fiveable.me/ap-statistics/unit-9/justifying-claim-about-slope-regression-model-based-on-confidence-interval/study-guide/RZiwGnIkfD5Y67n7rVrY) and Unit 9 overview (https://library.fiveable.me/ap-statistics/unit-9). For extra practice, try problems at (https://library.fiveable.me/practice/ap-statistics).
Why does my confidence interval get narrower when I have more data points?
Short answer: more data gives a narrower confidence interval mostly because the standard error of the slope gets smaller as n increases. Why: the margin of error for a slope is t* × s_b. The standard error s_b (estimate of variability in b1) is roughly s / (s_x · sqrt(n))—s is the residual standard error and s_x is the spread of the x-values. Increasing n makes the sqrt(n) bigger, so s_b gets smaller. That reduces the margin of error. Also, as n grows your t* (critical value for the t-distribution) gets a bit smaller because degrees of freedom increase. So you get two effects shrinking the CI: smaller standard error and a (slightly) smaller t*. Note the spread of x and model conditions matter: if s_x is tiny or conditions (linearity, equal variance) fail, more n won’t help much. For AP review see the Topic 9.3 study guide (https://library.fiveable.me/ap-statistics/unit-9/justifying-claim-about-slope-regression-model-based-on-confidence-interval/study-guide/RZiwGnIkfD5Y67n7rVrY) and more practice at (https://library.fiveable.me/practice/ap-statistics).