As discussed in section 9.0, Unit 9 deals with scatterplots and our ultimate question is how well our points from our sample align. In some cases, they align to a line; in other cases, possibly an exponential or quadratic equation. In AP Statistics, we primarily only focus on linear regression models. If they are not in a linear pattern, we know some techniques we can use to make our points better fit a linear pattern.
Correlation
In our linear regression models, we are aiming at measuring the correlation between the two variables based on our data set. One thing that is important to note is that sometimes correlation may seem present, however, it is due to merely random chance.
For instance, we can measure the inches of rain for every day and the number of the day of the month it was and plot the points with the day of the month on the x-axis and inches of rain on the y-axis. It is possible that we may see some sort of pattern that appears that the two things are correlated even though we know that is nonsense. This “correlation” would be due to random chance alone and not some sort of relationship between our two variables.
Also, it is so important to remember: correlation does not mean causation!
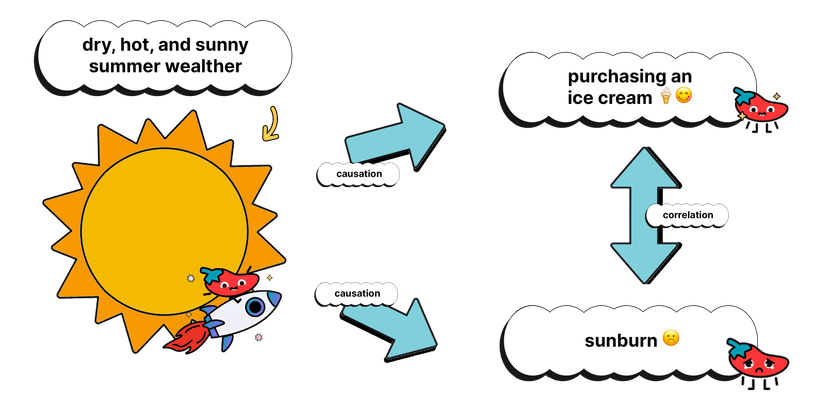

Causation
As we stressed in Unit 2, two variables may be correlated, but that does not establish a cause and effect relationship. As in the example above, a hot sunny day causes the ice cream to melt and it also causes sunburn. However, it would be silly to say that ice cream melting causes sunburn. The two things are correlated due to another variable: the hot sun (which influences ice cream consumption and sunburn).
Just like with any statistical study, it is wise to investigate any other variables that may be playing a part in your outcome. These variables are called confounding variables.
Repetition
A good scientific way to ensure that your results are not due to random chance is to do two things:
- Have a large sample size for your data set.
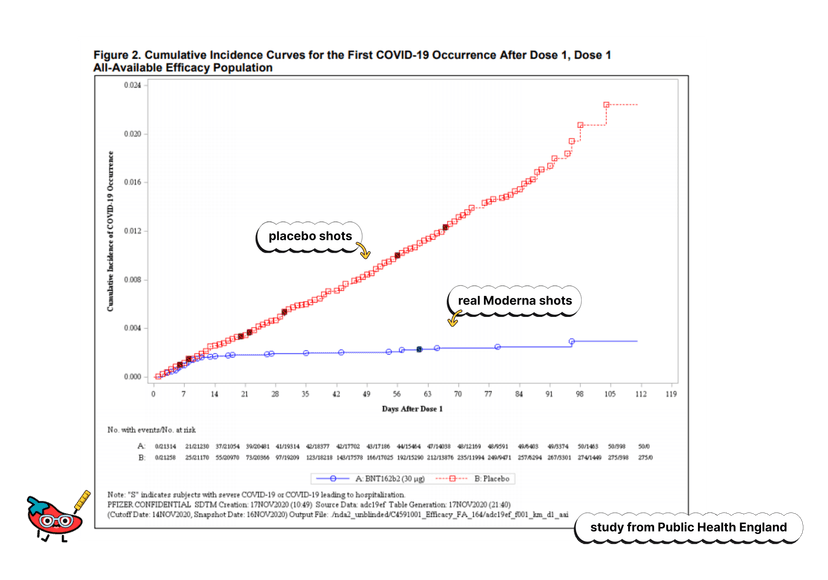
- Repeat the study in multiple populations with several large random samples. For instance, consider the COVID-19 vaccine trials. When performing the clinical trials, it was imperative that they were using a large sample to randomly assign treatments. This ensured the safety of the vaccine across a broad scope but also reduced any correlation in our pattern to a non-random correlation, not just pure sampling variability between the placebo group and vaccine group.
Also, the same clinical trials were performed in multiple samples in various countries. This supports the effectiveness of the vaccines across multiple populations and strengthens the cause for vaccine administration around the globe. Yay for good news!
Variation in the World of Slopes
Variation in points’ positions relative to a theoretical line may be random or non-random.
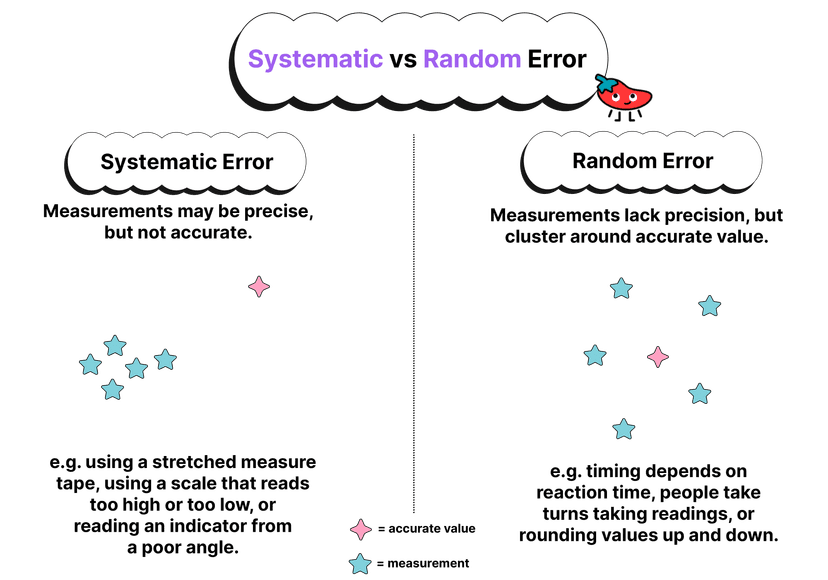
When the variation in the position of points relative to a theoretical line is random, it is called random error. This type of error is unpredictable and is due to factors that are beyond the control of the person conducting the experiment or making the measurement.
On the other hand, when the variation in the position of points relative to a theoretical line is non-random, it is called systematic error. This type of error is predictable and is due to factors that can be controlled, such as the accuracy of the measuring instrument or the technique used to make the measurement.
Examples
Here are some examples of random error:
- Fluctuations in the power supply while using an electronic balance to weigh an object
- Temperature changes in the environment while conducting a chemical reaction
- Wind gusts affecting the flight of a thrown object
And here are some examples of systematic error:
- Using a ruler that is not made correctly to measure the length of an object
- Using a thermometer that has not been calibrated to measure the temperature of a solution
- Using a pipette that is not properly calibrated to dispense a precise volume of a liquid
Vocabulary
The following words are mentioned explicitly in the College Board Course and Exam Description for this topic.
| Term | Definition |
|---|---|
| non-random variation | Variation in data points that follows a systematic or predictable pattern rather than occurring by chance. |
| scatter plots | A graph that displays the relationship between two quantitative variables, with each point representing an observation. |
| variation | Differences in data that occur by chance due to the random nature of sampling, rather than from systematic causes. |
Frequently Asked Questions
How do I tell if points on a scatter plot are randomly scattered or following a pattern?
Quick checklist you can use on any scatterplot to decide if points are randomly scattered or following a pattern: 1. Eyeball it first—do points cluster around a straight line or show a curve, fan shape, or distinct groups? Curves, clusters, or fan shapes are non-random patterns. 2. Fit the least-squares regression line (LSRL) and make a residual plot (observed − predicted). If residuals look randomly scattered around 0 with no shape, variation is likely random. Any systematic pattern (U-shape, trend, fan/“megaphone”) means non-random variation (linearity or heteroscedasticity problems). 3. Check summary stats: Pearson r near ±1 indicates strong linear association; r^2 shows how much variation the line explains. Large residuals = outliers; points that drastically change the slope are influential. 4. For AP: use these checks to identify questions suggested by variation and to verify conditions for inference on a slope—linearity, equal variance, normal residuals, and random sampling (CED VAR-1.K and Topic 9.1). For a quick refresher, see the Topic 9.1 study guide (https://library.fiveable.me/ap-statistics/unit-9/introducing-statistics-do-those-points-align/study-guide/ZtuZL4e78hxLHe4Kdq0P). More unit review (https://library.fiveable.me/ap-statistics/unit-9) and practice problems (https://library.fiveable.me/practice/ap-statistics).
What's the difference between random variation and non-random variation in scatter plots?
Random variation: the points (or residuals) scatter randomly around the least-squares line with no clear shape—small ups and downs you’d expect from natural noise. In a residual plot you’d see points roughly centered at 0 with no trend; that supports linearity and lets you use inference for the slope (what the CED calls VAR-1.K.1). Non-random variation: the deviations show a pattern—a curve, fanning (heteroscedasticity), clusters, or a gap—or there are outliers/influential points. Those patterns suggest model misfit (nonlinearity, changing spread, subgroups, or a point that unduly changes the slope). If you see non-random variation, you should ask why and consider transforming data, a different model, or investigating the outlier. On the AP, you’ll be asked to identify these questions from scatterplots/residual plots (Topic 9.1). For a quick review, see the Topic 9.1 study guide (https://library.fiveable.me/ap-statistics/unit-9/introducing-statistics-do-those-points-align/study-guide/ZtuZL4e78hxLHe4Kdq0P) and practice problems (https://library.fiveable.me/practice/ap-statistics).
When I look at a scatter plot, how do I know if the points actually align or if it's just random?
Short answer: look for a pattern and test it. Visually, non-random alignment shows a clear straight-line pattern (points clustered around a line, little scatter), while random variation looks like no pattern. Use the least-squares regression line (LSRL) and residuals: if residuals (observed − predicted) are randomly scattered around 0, the linear model is reasonable; if they show a pattern (curve, fan shape = heteroscedasticity, or clumps), that’s non-random variation. Quantify strength with r (Pearson correlation) and r²; larger |r| and bigger r² mean stronger linear association. To decide if it’s more than chance, run an inference test on the slope (H0: β = 0)—a small p-value says the linear pattern is unlikely due to random variation (see Topics 9.4–9.6). Watch for outliers/influential points (they can create spurious alignment). For a quick walk-through, check the Topic 9.1 study guide (https://library.fiveable.me/ap-statistics/unit-9/introducing-statistics-do-those-points-align/study-guide/ZtuZL4e78hxLHe4Kdq0P). Practice more with problems at (https://library.fiveable.me/practice/ap-statistics).
I'm confused about what "theoretical line" means in statistics - can someone explain?
Think of a "theoretical line" as the ideal straight relationship you expect between x and y—the model you'd get if you knew the true underlying relationship. In scatterplots we usually mean either the population (true) regression line (β0 + β1x) or the sample least-squares regression line (ŷ = a + bx) as an estimate of that truth. Points' vertical distances from that line are residuals. If those residuals look random (no pattern) the linear model is reasonable; if they show a pattern (curvature, clustering, increasing spread) that’s non-random variation and suggests the model or conditions (linearity, equal spread, normality for inference) aren’t met. For AP Stat, you should be able to identify when variation around a theoretical line is random vs non-random and use residual plots to check assumptions (Topic 9.1). For a quick refresher, see the Topic 9.1 study guide (https://library.fiveable.me/ap-statistics/unit-9/introducing-statistics-do-those-points-align/study-guide/ZtuZL4e78hxLHe4Kdq0P) and more unit resources (https://library.fiveable.me/ap-statistics/unit-9). Practice problems are at (https://library.fiveable.me/practice/ap-statistics).
What questions should I be asking when I see variation in a scatter plot?
When you see variation in a scatterplot, ask these focused questions (use AP terms): - Is there an overall pattern? (direction: positive/negative, shape: linear vs. curved) - How strong is the association? (does scatter look tight or loose—think correlation r) - Are there outliers or influential points that don’t follow the pattern? (could change slope or r) - Do points cluster by groups? (possible lurking/categorical variables) - Is the spread of y around the pattern roughly constant or does it change with x? (heteroscedasticity) - Are the deviations random or showing a nonrandom pattern? (inspect a residual plot) - If you fit the LSRL, what are residuals like? (any pattern → linear model assumptions fail) - Was the data collected appropriately? (random sample or randomized experiment, and 10% condition for inference) If you want practice: check the Topic 9.1 study guide (https://library.fiveable.me/ap-statistics/unit-9/introducing-statistics-do-those-points-align/study-guide/ZtuZL4e78hxLHe4Kdq0P), the Unit 9 overview (https://library.fiveable.me/ap-statistics/unit-9), and try problems at (https://library.fiveable.me/practice/ap-statistics). These steps line you up to verify conditions before doing inference on the slope.
How do I identify if the variation in my scatter plot data is significant or just noise?
Look at both the plot and the math. First eyeball the scatter: if points cluster tightly around a straight line, variation is likely non-random; if they’re widely scattered with no slope, it’s probably noise. Then fit the least-squares regression line and check: - Residual plot: residuals should look like random scatter (no curve, no funnel). A pattern (curve, fan shape = heteroscedasticity) means non-random variation or a wrong model. - Correlation r and R^2: r near 0 suggests mostly noise; r near ±1 means a strong linear pattern. R^2 tells the percent of y-variation explained by x. - Outliers / influential points: one extreme can create a misleading slope—identify with residuals and leverage. - Formal check: run the t-test for slope (H0: β = 0). A small p-value (p < α, commonly 0.05) gives convincing evidence the slope ≠ 0—variation is not just random. Make sure inference conditions are met (linearity, independence, normality of residuals, equal variance) before trusting the test. For an AP review of these steps and examples, see the Topic 9.1 study guide (https://library.fiveable.me/ap-statistics/unit-9/introducing-statistics-do-those-points-align/study-guide/ZtuZL4e78hxLHe4Kdq0P). For extra practice, try problems at (https://library.fiveable.me/practice/ap-statistics).
What does it mean when points deviate from a theoretical line in statistics?
If points deviate from a theoretical line (like the least-squares regression line), that deviation is measured by residuals—the vertical distances from each observed y to the predicted y. Deviations can be random (expected scatter around a true linear relationship) or non-random, which suggests problems: curvature (points follow a curve, so linearity is wrong), heteroscedasticity (spread changes with x), clustering, outliers, or influential points. Non-random patterns in a residual plot mean you shouldn’t trust linear-model inference (tests/confidence intervals for the slope) until you fix the model or transform the data. On the AP exam you’ll need to identify these patterns and say which regression condition fails (linearity, equal variance, normality of residuals, independence). Check a residual plot to diagnose and mention specific issues (e.g., “curved pattern → linearity fails,” “fan shape → heteroscedasticity,” “single extreme point → possible influential point”). For more practice and quick review see the Topic 9.1 study guide (https://library.fiveable.me/ap-statistics/unit-9/introducing-statistics-do-those-points-align/study-guide/ZtuZL4e78hxLHe4Kdq0P), the Unit 9 overview (https://library.fiveable.me/ap-statistics/unit-9), and 1000+ practice problems (https://library.fiveable.me/practice/ap-statistics).
I don't understand how to analyze scatter plots - what am I supposed to be looking for?
When you look at a scatterplot, ask four quick things: form, direction, strength, and weird points. - Form: Is the relationship linear or curved? AP cares about linearity for slope inference (VAR-1.K). - Direction: Positive or negative slope—does y tend to increase or decrease as x increases? - Strength: How close are points to an imaginary straight line? Tight cluster = strong; spread out = weak. Pearson r measures this. - Outliers & influential points: Spot points far from others or far from the x-range—they can change the least-squares regression line (LSRL) and slope tests. Also check for patterns in the residuals (random scatter vs non-random pattern) and heteroscedasticity (spread changing with x). If residuals show structure, linear methods aren’t appropriate. For AP: mention linearity and randomness of variation when justifying slope tests or confidence intervals, and use residual plots when checking conditions (see Topic 9.1 study guide on Fiveable: (https://library.fiveable.me/ap-statistics/unit-9/introducing-statistics-do-those-points-align/study-guide/ZtuZL4e78hxLHe4Kdq0P)). For more practice, try the unit page (https://library.fiveable.me/ap-statistics/unit-9) and 1000+ practice problems (https://library.fiveable.me/practice/ap-statistics).
When do I say that points align versus when they're just randomly distributed?
Say the points “align” when they show a clear linear pattern and the residuals from the least-squares line look like random scatter around zero (no curved pattern, no funnel shape, no obvious clusters or outliers). Practically: fit the LSRL, make a residual plot, and check these CED conditions for regression inference—linearity (no systematic pattern in residuals), equal variance (homoscedasticity), independence, and roughly normal residuals when required. If residuals are randomly distributed around 0 and |r| is moderately large (and R² explains meaningful variation), the linear model is reasonable. If you see curvature, heteroscedasticity, clustering, or influential points, the pattern is non-random and a linear model is not appropriate. For AP: you’ll justify linearity using the residual plot when doing inference on slope (Topics 9.4–9.6). Review examples on the Topic 9.1 study guide (https://library.fiveable.me/ap-statistics/unit-9/introducing-statistics-do-those-points-align/study-guide/ZtuZL4e78hxLHe4Kdq0P), the Unit 9 overview (https://library.fiveable.me/ap-statistics/unit-9), and drill practice (https://library.fiveable.me/practice/ap-statistics).
What's the step-by-step process for determining if variation in a scatter plot is random?
Step-by-step: 1. Fit the least-squares regression line (LSRL) to the scatterplot (or eyeball a theoretical line). 2. Compute residuals: residual = observed y − predicted y. Make a residual plot (residuals vs. x). For random variation you want residuals scattered roughly horizontally around 0 with no clear pattern. 3. Check patterns: look for curvature (nonlinearity), systematic trends, clustering, or waves—any of these mean variation is non-random (nonlinear or model misspecification). 4. Check spread: residuals should have roughly constant variability (no funnel shape → heteroscedasticity). 5. Identify outliers and influential points (large residuals or high leverage). Remove/flag and re-evaluate model if needed. 6. Quantify association: compute r and R^2. If r is near 0 and residuals show no pattern, variation is likely random around the line. If r is large but residuals show structure, variation is non-random. 7. For formal inference about slope, verify conditions: linearity, nearly normal residuals, constant SD, and random sampling/randomized experiment (CED Topic 9.1/Unit 9). For a quick refresher and examples, see the Topic 9.1 study guide (https://library.fiveable.me/ap-statistics/unit-9/introducing-statistics-do-those-points-align/study-guide/ZtuZL4e78hxLHe4Kdq0P) and more practice (https://library.fiveable.me/practice/ap-statistics).
How can I tell if my data points suggest a real relationship or if it's just coincidence?
Look at patterns, not just a few points. First make a scatterplot and fit the least-squares regression line (LSRL). Check the residuals: random scatter of small residuals → variation is likely random; a clear pattern, trend, increasing spread (heteroscedasticity), or big residuals → non-random. Compute r to measure linear strength and run an inference test on the slope (H0: β = 0). A small p-value for the slope means the relationship is unlikely due to chance—that’s evidence of a real linear association. Watch for outliers or influential points (they can inflate r or change the slope); use residual plots and leverage diagnostics. For AP: you should be able to describe scatterplots, LSRL, residuals, r, and set up/interpret a test for slope (Topic 9.1–9.5). For a quick review use the Topic 9.1 study guide (https://library.fiveable.me/ap-statistics/unit-9/introducing-statistics-do-those-points-align/study-guide/ZtuZL4e78hxLHe4Kdq0P), the unit overview (https://library.fiveable.me/ap-statistics/unit-9), and practice questions (https://library.fiveable.me/practice/ap-statistics).
What are some examples of non-random variation in scatter plots that I should recognize?
Non-random variation = patterns in the residuals that signal your linear model isn’t capturing something. Look for these common examples on scatterplots/residual plots: - Curvature: points systematically bend above then below the LSRL → relationship isn’t linear. - Heteroscedasticity (funnel): spread of y’s increases or decreases with x (residuals fan out) → non-constant variance. - Clustering or gaps: distinct groups of points or big empty regions suggest a lurking categorical variable or different subpopulations. - Outliers and influential points: single points far from others (outlier) or far in x that change slope a lot (influential). - Oscillation/periodicity: regular up–down pattern—suggests a non-linear (e.g., sinusoidal) relationship. On the AP exam you’ll often use residual plots to check linearity and constant variance (Topic 9.1). For more examples and practice, see the Topic 9.1 study guide (https://library.fiveable.me/ap-statistics/unit-9/introducing-statistics-do-those-points-align/study-guide/ZtuZL4e78hxLHe4Kdq0P) and try problems at (https://library.fiveable.me/practice/ap-statistics).
I missed class on scatter plot analysis - what's the main concept I need to understand about point alignment?
Main idea: when you look at a scatterplot you’re asking whether the points line up well enough to justify a straight-line model (least-squares regression line) or whether the variation is nonrandom and suggests something else. Check for direction, form, and strength: is there a clear linear trend (positive/negative), are points tightly clustered around a line (strong) or spread out (weak), or do you see patterns—curvature, clustering, fan shape (heteroscedasticity), outliers, or influential points? Use a residual plot: random scatter of residuals ≈ good linear fit; systematic pattern ≈ violation of linearity or equal variance. Pearson’s r measures linear association but doesn’t prove causation. For AP: you’ll need to assess these conditions before doing inference about slope (linearity, normality/equal spread, independence); a residual plot is the go-to check. For a quick review, see the Topic 9.1 study guide (https://library.fiveable.me/ap-statistics/unit-9/introducing-statistics-do-those-points-align/study-guide/ZtuZL4e78hxLHe4Kdq0P). For more unit review and practice, check Unit 9 (https://library.fiveable.me/ap-statistics/unit-9) and practice problems (https://library.fiveable.me/practice/ap-statistics).
How do I write about variation in scatter plots for AP Stats free response questions?
When you write about variation in a scatterplot on an AP free-response, be specific and tie words to CED ideas: say whether the scatter shows random variation (points scattered fairly evenly around a fitted/LSR line) or non-random variation (clear curve, clusters, funnel shape, or patterns). Call out: - outliers or influential points (identify x/y and explain effect on the slope or r), - clustering (two or more groups → consider separate relationships), - heteroscedasticity (spread of y-values changing with x → violates equal-variance condition), - curvature (nonlinear pattern → linear model inappropriate), - residual behavior (use/residual plot: residuals ≈ 0 with no pattern = good; pattern = nonrandom). Always link your comment to context (units, what x and y are) and to inference conditions when relevant. For more examples and wording you can use on the exam, see the Topic 9.1 study guide (https://library.fiveable.me/ap-statistics/unit-9/introducing-statistics-do-those-points-align/study-guide/ZtuZL4e78hxLHe4Kdq0P) and practice problems (https://library.fiveable.me/practice/ap-statistics).
What's the difference between looking at individual points versus the overall pattern in a scatter plot?
Looking at individual points means noticing outliers, influential points, or small clusters—those single observations can pull the least-squares regression line, change residuals, or suggest data-entry errors. Looking at the overall pattern means describing the bulk behavior: direction (positive/negative), form (linear vs. curved), strength (tight vs. scattered, which r summarizes), and any non-random variation like heteroscedasticity. For AP Stats (Topic 9.1, VAR-1.K), you should ask: are deviations from a straight line random (just scatter) or non-random (pattern, curvature, clusters)? Use a residual plot to check linearity and equal spread; watch for influential points before doing slope inference or tests. On the exam you’ll need to justify conditions (linearity, normality for inference when required) and note any outliers/influencers. For a focused review see the Topic 9.1 study guide (https://library.fiveable.me/ap-statistics/unit-9/introducing-statistics-do-those-points-align/study-guide/ZtuZL4e78hxLHe4Kdq0P) and practice lots of problems (https://library.fiveable.me/practice/ap-statistics).