The Most Important Part(s) of Unit 8...
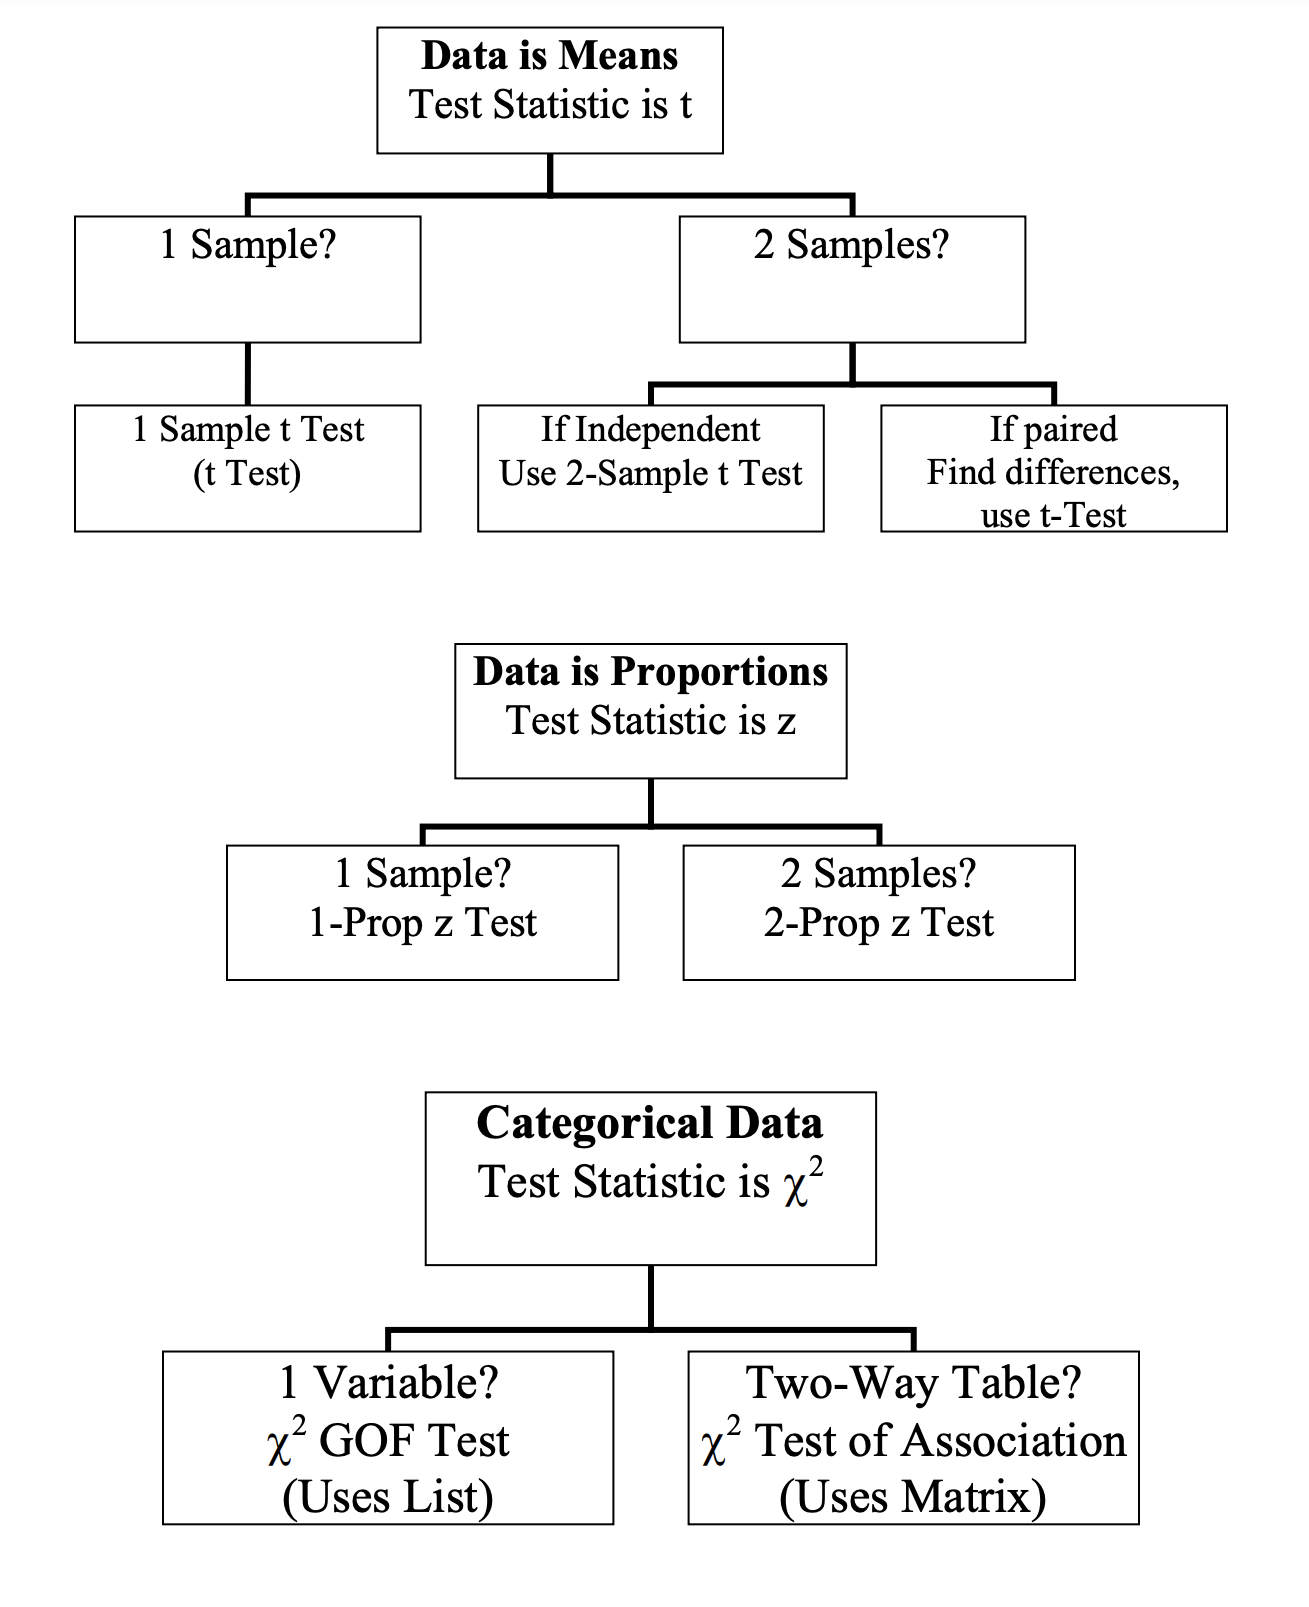
The most difficult and most important part of Unit 8 is being able to select which Chi-Squared test to perform. Be sure to study these important distinctions for clarity on which test to select:
- Goodness of Fit Test: One sample, one categorical variable with more than two categories
- Independence Test: One sample, two categorical variables with multiple categories
- Homogeneity Test: Two samples, one categorical variable with possible multiple categories It is very likely that you will see one or two multiple-choice questions on this exact content: selecting an appropriate inference method.

Example
On the 2009 AP Statistics exam, the following question was presented in the FRQ section:
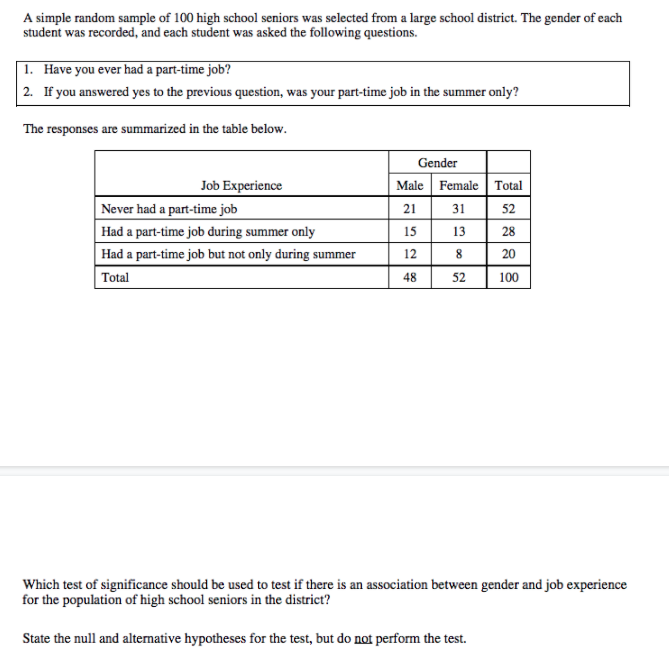
The first thing we should notice is that this data is dealing with categorical data. This tells us that we should either use a z-test or a chi-squared test, depending on how many variables and categories we are dealing with.
Then we notice that there are two categorical variables with two to three categories apiece. This narrows out a z-test since a 1-prop z-test or 2-prop z-test would only be valid if each variable only had two categories. Since we have two variables with multiple categories, this shifts us to a chi-squared procedure.
Now, we are stuck between the three types of chi-squared tests. Uh-oh...
The first thing to notice now is that we have a two-way table, not a one way table with multiple rows/columns so that narrows it down to either chi-squared test for independence or chi-squared test for homogeneity.
The last thing we need to check in narrowing this down is how many samples/populations we have. Since we only took one sample and asked their gender and job experience, this would mean that we are looking at the association between gender and job experience, not the difference in two populations. Therefore, we should run a chi-squared test for independence.
Our hypotheses then should be:
- H0: There is no association between gender and job experience for high school seniors in the district.
- Ha: There is an association between gender and job experience for high school seniors in the district.
Things to remember: be sure to put your hypotheses in context and your null hypothesis is always the “expected” outcome (i.e., there is nothing special going on).
Practice Problem
(1) A researcher is interested in determining whether the distribution of favorite ice cream flavors among college students is the same as the distribution of favorite ice cream flavors among the general population. They survey a random sample of 500 college students and find that 280 students prefer chocolate, 120 students prefer vanilla, 50 students prefer strawberry, and 50 students prefer mint. The researcher also surveys a random sample of 1000 people from the general population and finds that 400 people prefer chocolate, 300 people prefer vanilla, 200 people prefer strawberry, and 100 people prefer mint. The researcher wants to know whether the distribution of favorite ice cream flavors is the same among college students and the general population.
To answer this question, the researcher plans to conduct a chi-squared test for goodness of fit. However, the researcher is unsure whether a chi-squared test for goodness of fit, homogeneity, or independence is the appropriate test to use.
Which test should the researcher use and why?
(2) A scientist is studying the effectiveness of a new treatment for a particular disease. They conduct a clinical trial with 100 patients and divide them into two groups: a treatment group and a control group. The treatment group receives the new treatment, while the control group receives a placebo. The scientist wants to determine whether the treatment is effective at reducing the occurrence of the disease in male and female patients.
To do this, the scientist plans to conduct a chi-squared test for independence. However, the scientist is unsure whether a chi-squared test for goodness of fit, homogeneity, or independence is the appropriate test to use.
Which test should the scientist use and why?
(3) A travel company is interested in determining whether the distribution of vacation package choices made by their customers fits a theoretical distribution that they formulated based on previous years' trends in domestic and international travel. The company surveyed 1000 customers and found that 400 customers chose a beach vacation package, 300 customers chose a mountain vacation package, 200 customers chose a city vacation package, and 100 customers chose a rural vacation package.
The travel company plans to conduct a chi-squared test for independence to answer their research question. However, they are unsure whether a chi-squared test for goodness of fit, homogeneity, or independence is the appropriate test to use.
Which test should the travel company use and why?
Answer
(1) The appropriate test for this situation is a chi-squared test for independence. This is because the researcher is interested in determining whether the distribution of favorite ice cream flavors is the same between two groups (college students and the general population), which is a test of independence.
A chi-squared test for goodness of fit would be used if the researcher was interested in determining whether the observed distribution of favorite ice cream flavors among college students fits a theoretical distribution.
A chi-squared test for homogeneity would be used if the researcher was interested in determining whether the distribution of favorite ice cream flavors is the same among different subgroups within a single population (such as male and female college students).
Therefore, the researcher should use a chi-squared test for independence to determine whether the distribution of favorite ice cream flavors is the same between college students and the general population.
(2) The appropriate test for this situation is a chi-squared test for homogeneity. This is because the scientist is interested in determining whether the distribution of the disease is the same among male and female patients within a single group (the treatment group). A chi-squared test for homogeneity allows the scientist to determine whether there is a difference in the distribution of the disease between male and female patients in the treatment group.
A chi-squared test for goodness of fit would be used if the scientist was interested in determining whether the observed distribution of the disease among the treatment group fits a theoretical distribution.
A chi-squared test for independence would be used if the scientist was interested in determining whether there is a relationship between the treatment (the independent variable) and the occurrence of the disease (the dependent variable).
Therefore, the scientist should use a chi-squared test for homogeneity to determine whether there is a difference in the distribution of the disease between male and female patients in the treatment group.
(3) The appropriate test for this situation is a chi-squared test for goodness of fit. This is because the travel company is interested in determining whether the observed distribution of vacation package choices fits a theoretical distribution. A chi-squared test for goodness of fit allows the travel company to compare the observed distribution with the theoretical distribution and determine whether the two are similar.
A chi-squared test for independence would be used if the travel company was interested in determining whether there is a relationship between two variables (such as the type of vacation package and the destination chosen).
A chi-squared test for homogeneity would be used if the travel company was interested in determining whether the distribution of vacation package choices is the same among different subgroups within a single population (such as male and female customers).
Therefore, the travel company should use a chi-squared test for goodness of fit to determine whether the observed distribution of vacation package choices fits a theoretical distribution.
Frequently Asked Questions
How do I know when to use a chi-square test vs a z-test for proportions?
Use a two-proportion z-test when you’re comparing exactly two proportions (like treatment vs control) and the sampling distribution of the difference in sample proportions is approximately normal. Conditions: independent random samples, and "large counts"—each sample should have at least about 10 successes and 10 failures (so the standard error formula is reliable). If you’re testing equality of two proportions, compute the pooled proportion for the SE. Use a chi-square test when you have categorical data with more than two groups or more than two categories per variable, or when you want a single test that handles an r × c contingency table. Types: goodness-of-fit (one categorical variable, compare observed to expected), test of independence or homogeneity (two categorical variables). Conditions: independent random sampling and expected cell counts generally ≥ 5. Degrees of freedom = (rows−1)(cols−1). For tiny samples or when expected counts <5, use Fisher’s exact test or a randomization test instead. For AP alignment and practice, review Topic 8.7 (selecting procedures) on Fiveable (study guide: https://library.fiveable.me/ap-statistics/unit-8/selecting-an-appropriate-inference-procedure-for-categorical-data/study-guide/0hC6NNjpHXs0x44bc2Fl; unit overview: https://library.fiveable.me/ap-statistics/unit-8) and try practice problems (https://library.fiveable.me/practice/ap-statistics).
What's the difference between a goodness of fit test and a test for independence?
Goodness-of-fit and test for independence both use χ² but answer different questions. - Goodness-of-fit: asks whether one categorical variable’s observed distribution matches a specified single distribution (e.g., fair die or given percentages). You use one-way counts, expected counts from the claimed proportions, χ² = Σ(Observed–Expected)²/Expected, df = k − 1 (k = number of categories). Check large-counts condition (expected ≥ 5 or use simulation/Fisher’s ideas if small). - Test for independence: asks whether two categorical variables are associated (no relationship) in a contingency table. Observed are the table counts; expected = (row total × column total)/grand total; χ² uses those expected counts and df = (r − 1)(c − 1). Also check large-counts condition; if many small expected counts, consider Fisher’s exact test or a permutation/randomization approach. Both are in Unit 8 (chi-square inference). For quick review, see the Topic 8.7 study guide (https://library.fiveable.me/ap-statistics/unit-8/selecting-an-appropriate-inference-procedure-for-categorical-data/study-guide/0hC6NNjpHXs0x44bc2Fl), the unit overview (https://library.fiveable.me/ap-statistics/unit-8), and lots of practice problems at (https://library.fiveable.me/practice/ap-statistics).
I'm so confused about categorical data inference - when do I use which test?
Short cheat sheet so you’ll know which test to pick: - One-proportion z-test: use when you’re testing a single population proportion (H0: p = something). Need a random sample and large counts (np̂ and n(1−p̂) both ≳ 10 on AP problems; use the formula and z-critical values). - Two-proportion z-test (unpooled vs pooled): use to compare p1 and p2. For hypothesis tests that assume p1 = p2 under H0, use the pooled proportion to compute the SE. Also requires large counts in each group (expected successes/failures ≳ 5). - Chi-square goodness-of-fit: use when you test whether a single categorical distribution matches specified proportions across 3+ categories. Work with counts, compute expected counts, df = (k−1). - Chi-square test of independence / homogeneity: use for relationships between two categorical variables in an r×c table. Conditions: random sample, expected counts generally ≥5, df = (r−1)(c−1). Remember chi-square uses counts (not proportions). - Fisher’s exact test or permutation/randomization: use when sample sizes or expected counts are too small for chi-square (especially 2×2 tables). AP accepts randomization/permutation approaches too. Extras: Yates’ continuity correction is rarely required on the AP. For practice on selecting methods, see the Topic 8.7 study guide (https://library.fiveable.me/ap-statistics/unit-8/selecting-an-appropriate-inference-procedure-for-categorical-data/study-guide/0hC6NNjpHXs0x44bc2Fl), the Unit 8 overview (https://library.fiveable.me/ap-statistics/unit-8), and >1000 practice problems (https://library.fiveable.me/practice/ap-statistics).
How do I solve a chi-square goodness of fit problem step by step?
Step-by-step for a chi-square goodness-of-fit test (AP style): 1. State hypotheses in context: H0 = the categorical distribution matches the claimed proportions; Ha = it does not. 2. Check conditions: data from a random sample/experiment and the large counts rule (all expected counts ≥ 5). If not met, consider simulation/Fisher’s exact (when small). 3. Compute expected counts: expected = (total sample size) × (claimed proportion) for each category. 4. Calculate the chi-square statistic: χ² = Σ[(observed − expected)² / expected] across categories. 5. Degrees of freedom: df = k − 1 (k = number of categories). 6. Find the p-value: use χ² table, calculator, or software (AP students may use table on the formula sheet). Compare p to α. 7. Conclusion in context: if p ≤ α reject H0 (evidence the distribution differs); if p > α fail to reject H0 (no convincing evidence). 8. Always state limitations and connect conclusion to the real-world context. Review Topic 8.2–8.3 for examples and walk-throughs (study guide: https://library.fiveable.me/ap-statistics/unit-8/selecting-an-appropriate-inference-procedure-for-categorical-data/study-guide/0hC6NNjpHXs0x44bc2Fl). For unit review and extra practice, see https://library.fiveable.me/ap-statistics/unit-8 and thousands of problems at https://library.fiveable.me/practice/ap-statistics.
What's the formula for the chi-square test statistic?
The chi-square test statistic is χ² = Σ (Observed − Expected)² / Expected You compute this sum over all cells in your table. “Observed” are the counts you actually saw; “Expected” are the counts you’d expect under H₀ (for goodness-of-fit: expected = n × hypothesized proportion for each category; for independence/homogeneity: expected = (row total × column total) / grand total). Degrees of freedom: goodness-of-fit df = k − 1; independence/homogeneity df = (rows − 1)(cols − 1). Check the large-counts condition (usually expected counts ≥ 5) before using χ²; otherwise use exact or simulation methods. The AP formula sheet gives the same χ² formula—practice applying it on the Topic 8.7 study guide (https://library.fiveable.me/ap-statistics/unit-8/selecting-an-appropriate-inference-procedure-for-categorical-data/study-guide/0hC6NNjpHXs0x44bc2Fl). For more review and practice, see the Unit 8 overview (https://library.fiveable.me/ap-statistics/unit-8) and Fiveable practice problems (https://library.fiveable.me/practice/ap-statistics).
When do I use a one-sample z-test for proportions vs a two-sample z-test?
Use a one-sample z-test for a proportion when you’re asking about a single population proportion (H0: p = p0). Example: “Is the proportion of students who bike to school equal to 0.30?” Conditions: random sample, independence (10% rule), and large counts under H0 (np0 and n(1−p0) ≥ 10). Use a two-sample z-test for proportions when you’re comparing two independent groups (H0: p1 = p2). Example: “Are freshmen and seniors equally likely to prefer online classes?” Conditions: two independent random samples, each satisfies large-counts (n1 p̂1, n1(1−p̂1), n2 p̂2, n2(1−p̂2) ≥ 10). For the test statistic, if H0 assumes p1 = p2 you use the pooled proportion p̂c = (x1 + x2)/(n1 + n2) to compute the standard error. AP exam keywords to check: pooled proportion, large counts condition, independence, two-proportion z-test (see Topic 8.7 study guide for decision rules and examples: https://library.fiveable.me/ap-statistics/unit-8/selecting-an-appropriate-inference-procedure-for-categorical-data/study-guide/0hC6NNjpHXs0x44bc2Fl). For more review and practice, see the Unit 8 overview (https://library.fiveable.me/ap-statistics/unit-8) and practice problems (https://library.fiveable.me/practice/ap-statistics).
Can someone explain the conditions for chi-square tests - I keep forgetting them?
Quick checklist you can memorize: - Data type and design: counts (not means or percentiles) from a random sample or randomized experiment; categories are mutually exclusive. This satisfies the independence assumption (observations independent). - Expected counts (large counts rule): every expected cell count should be ≥ 5 for the chi-square approximation to be reliable. If many cells are <5, use Fisher’s exact test (small samples) or a simulation/randomization test. - Degrees of freedom: goodness-of-fit df = k − 1 (k = # categories); for two-way tables df = (rows − 1)(cols − 1). Use the chi-square statistic χ² = Σ((obs − exp)²/exp) and compare to the χ² table (AP formula sheet/Table C). - Extras to know for the exam: for 2×2 some texts mention Yates’ continuity correction, but AP expects you to check expected counts and switch to Fisher’s or simulation if counts are too small. You can also use a permutation/randomization test for independence/homogeneity when conditions fail. For a short AP-focused review, see the Topic 8.7 study guide (https://library.fiveable.me/ap-statistics/unit-8/selecting-an-appropriate-inference-procedure-for-categorical-data/study-guide/0hC6NNjpHXs0x44bc2Fl) and practice questions (https://library.fiveable.me/practice/ap-statistics).
How do I know if I should do a one-tailed or two-tailed test for proportions?
Pick the tail based on the research question—not the sample result. Write H0 as the “=” statement and Ha to match the claim’s direction: - If the claim says “greater than” (p > p0), do a right-tailed (one-tailed) test. - If it says “less than” (p < p0), do a left-tailed (one-tailed) test. - If it asks “different from” or makes no direction (p ≠ p0), do a two-tailed test. On the AP exam you must state H0 and Ha correctly (Skill 1). Also check conditions: random sample, large counts (np and n(1−p) ≥ 10 for one-sample z), and whether you need a pooled proportion for two-sample z tests (CED keywords: pooled proportion, large counts). Use the tail to find critical z or to interpret the p-value: compare p-value to α in context. For more on choosing procedures for categorical data, see the Topic 8.7 study guide (https://library.fiveable.me/ap-statistics/unit-8/selecting-an-appropriate-inference-procedure-for-categorical-data/study-guide/0hC6NNjpHXs0x44bc2Fl) and the Unit 8 overview (https://library.fiveable.me/ap-statistics/unit-8). For extra practice, try problems at (https://library.fiveable.me/practice/ap-statistics).
What's the difference between testing for homogeneity and testing for independence?
Testing for homogeneity vs. testing for independence are very similar mathematically but answer different questions: - Test of homogeneity: you have separate groups (different populations or treatments) and you ask whether the distribution of a categorical variable is the same across those groups. Null: the category proportions are the same for every group. Data typically come from multiple independent samples. - Test of independence: you have one sample and two categorical variables measured on each unit; you ask whether the variables are associated. Null: the two variables are independent (no association) in the population. Both use chi-square on an r×c contingency table with expected = (row total × column total)/grand total and df = (r−1)(c−1), and both require random sampling and large expected counts (≈≥5) or else use Fisher’s exact or a randomization test. For a 2×2 you might instead see a two-proportion z-test (uses a pooled p under H0) but AP usually wants you to pick the correct categorical procedure (chi-square independence vs. homogeneity)—practice choosing these on the Unit 8 study guide (https://library.fiveable.me/ap-statistics/unit-8/selecting-an-appropriate-inference-procedure-for-categorical-data/study-guide/0hC6NNjpHXs0x44bc2Fl) and more problems at (https://library.fiveable.me/practice/ap-statistics).
I don't understand when to use the chi-square distribution vs the normal distribution for categorical data?
Use a z (normal) test when you’re comparing one or two proportions and the sampling distribution of the sample proportion(s) is approximately normal. That means: - The question is about a single proportion or difference of two proportions (one-sample z or two-sample z). - The independence/randomness condition holds. - The success–failure (large counts) condition is met (commonly np and n(1−p) ≳ 10 for z-tests). For a two-sample z-test you may use a pooled p̂ when H0 assumes equal proportions. Use a chi-square test when you have counts in ≥2 categories and you’re testing overall fit, homogeneity, or independence: - Chi-square goodness-of-fit for one categorical variable with many levels. - Chi-square test of independence / homogeneity for contingency tables (use df = (rows−1)(cols−1)). - Expected counts in every cell should be large enough (AP uses the “large counts” rule; a common classroom rule is expected count ≥ 5). - If cell counts are too small use Fisher’s exact test or a randomization/permutation approach. For AP-aligned review/examples, see the Topic 8.7 study guide (https://library.fiveable.me/ap-statistics/unit-8/selecting-an-appropriate-inference-procedure-for-categorical-data/study-guide/0hC6NNjpHXs0x44bc2Fl) and try practice problems (https://library.fiveable.me/practice/ap-statistics).
How do I calculate expected counts for a chi-square test and why do they matter?
For a chi-square test you calculate expected counts differently depending on the setup: - Goodness-of-fit (one categorical variable): expected count for category i = (total sample size) × (hypothesized proportion for category i). - Independence / homogeneity (two-way table): expected count for cell (row i, column j) = (row i total × column j total) / grand total. You use those expected counts in the chi-square statistic: χ² = Σ (observed − expected)² / expected. Expected counts matter because the χ² approximation to the sampling distribution assumes cells aren’t too small—AP’s large-counts rule is that all expected counts should be ≥ 5 (or at least most ≥ 5); if not, use Fisher’s exact test or a simulation/randomization test. Also compute degrees of freedom (goodness-of-fit: k−1; two-way: (r−1)(c−1)) to get p-values from the χ² table. For quick review and examples tied to Topic 8.7, see the Fiveable study guide (https://library.fiveable.me/ap-statistics/unit-8/selecting-an-appropriate-inference-procedure-for-categorical-data/study-guide/0hC6NNjpHXs0x44bc2Fl). For more practice, try the AP Stats practice problems (https://library.fiveable.me/practice/ap-statistics).
A word problem asks about comparing proportions between two groups - which test do I use?
If you’re comparing two proportions (two groups, yes/no outcome), start with the two-proportion z-test. Use it when: - You want to test p1 vs p2 (or build a CI for p1−p2). - The groups are independent (random samples or randomized experiment). - Large counts condition holds: each group has at least about 10 successes and 10 failures (so sampling distribution ≈ normal). - If H0: p1 = p2, use the pooled proportion p̂c = (x1+x2)/(n1+n2) to compute the SE and z statistic. If the sample sizes or expected counts are small (cells <10), use Fisher’s exact test (for 2×2) or a randomization/permutation test instead. If your data are a contingency table with >2 categories per variable, use a chi-square test of independence or homogeneity (check expected counts and df). AP CED keywords and conditions are covered in the Topic 8.7 study guide (https://library.fiveable.me/ap-statistics/unit-8/selecting-an-appropriate-inference-procedure-for-categorical-data/study-guide/0hC6NNjpHXs0x44bc2Fl). For extra practice, try problems at (https://library.fiveable.me/practice/ap-statistics).
What are the steps for doing a two-proportion z-test from start to finish?
When you do a two-proportion z-test, follow these steps: 1. State parameters & hypotheses: p1, p2 and H0: p1 = p2 (or p1 − p2 = 0). Choose Ha (≠, >, or <) in context. 2. Check conditions (AP/CED): random samples or randomized experiment; independence (each sample ≤10% of population); large counts—use pooled counts for the test: X1, X2 so that np̂c and n(1−p̂c) are ≥10 for each sample when H0 assumes equal proportions. 3. Compute pooled proportion p̂c = (X1 + X2)/(n1 + n2). 4. Compute standard error under H0: SE = sqrt[p̂c(1−p̂c)(1/n1 + 1/n2)]. 5. Compute z = (p̂1 − p̂2)/SE and find p-value from normal model (use z-table or calculator). 6. Draw conclusion: compare p-value to α, state decision in context and interpret effect size/ practical significance. 7. (Optional) For interval estimation use unpooled SE and build a CI for p1 − p2. For a quick topic review, see the Fiveable study guide (https://library.fiveable.me/ap-statistics/unit-8/selecting-an-appropriate-inference-procedure-for-categorical-data/study-guide/0hC6NNjpHXs0x44bc2Fl) and more practice (https://library.fiveable.me/practice/ap-statistics).
Why does my calculator keep giving me different p-values for chi-square tests?
Your calculator can give different p-values for the “same” categorical test because different procedures or adjustments are being used. Common reasons: - Different tests: chi-square (approximate), Fisher’s exact (exact for 2×2), and two-proportion z-tests all target similar questions but give different p-values—use Fisher’s for small counts or exact answers. - Yates’ continuity correction: some calculator/computer functions apply Yates’ correction for 2×2 chi-square, which makes p-values a bit larger (more conservative). - Condition violations: the chi-square approximation needs expected counts “large enough” (usually all ≥1 and most ≥5). If counts are small, software may switch to exact or simulation methods (giving different p). - Different implementations: menu choices on your calculator (chi-square test vs inputting table into regression/STAT commands) can call different algorithms. For AP work, check the test you intend to use (chi-square goodness-of-fit, test of independence/homogeneity, Fisher’s exact, or two-proportion z), verify expected counts and independence/randomness, and pick the correct method. Want a quick walkthrough for your specific table? Share the observed counts and I’ll tell you which procedure the AP CED expects (see the Topic 8.7 study guide (https://library.fiveable.me/ap-statistics/unit-8/selecting-an-appropriate-inference-procedure-for-categorical-data/study-guide/0hC6NNjpHXs0x44bc2Fl) and unit overview (https://library.fiveable.me/ap-statistics/unit-8)). For extra practice, Fiveable has lots of AP-style problems (https://library.fiveable.me/practice/ap-statistics).
I missed class and I'm lost - what are all the different tests for categorical data and when do I use each one?
Quick roadmap—which test to use for categorical data: - One proportion (z) test / CI: use when you have one sample and want to test or estimate p. Conditions: random, large counts (np̂ and n(1−p̂) ≳ 10 for AP-style), use normal approx. - Two-proportion z-test / CI: comparing two independent proportions (p1 vs p2). Conditions: random, large counts in all four cells; if H0 assumes p1=p2 you use the pooled proportion for the SE. - Chi-square goodness-of-fit: one categorical variable with >2 categories; test whether observed counts match expected distribution. Conditions: random, expected counts ≳ 5, df = k−1. - Chi-square test of independence / homogeneity (two-way table): use for association (independence) or comparing distributions across groups (homogeneity). Conditions: random, expected counts ≳ 5 in each cell, df = (r−1)(c−1). - Fisher’s exact test: use instead of chi-square when sample is small and expected counts <5 (especially 2×2). - Randomization/permutation test: alternative when assumptions fail (nonrandomization, small n); uses simulation to get p-value. - Continuity correction (Yates’) and other tweaks: rarely required on AP; mention only if asked. For AP exam practice and quick refresh see the Topic 8.7 study guide (https://library.fiveable.me/ap-statistics/unit-8/selecting-an-appropriate-inference-procedure-for-categorical-data/study-guide/0hC6NNjpHXs0x44bc2Fl), the Unit 8 overview (https://library.fiveable.me/ap-statistics/unit-8), and lots of practice problems (https://library.fiveable.me/practice/ap-statistics).