Expected Counts (and the Unexpected?)
In a statistical test, the expected count is the number of observations that you would expect to see in a particular category if the null hypothesis were true. The null hypothesis is a statistical hypothesis that states that there is no difference between the variables being tested.
To calculate the expected count for a particular category, you would take the sample size and multiply it by the probability of being in that category under the null hypothesis. For example, if you have a sample of 1000 people and the null hypothesis is that there is no difference in political party affiliation between men and women, you would calculate the expected counts for men and women separately by multiplying the sample size by the probability of being a man or a woman.
Expected counts are used in statistical tests to determine whether the observed counts are significantly different from what you would expect to see if the null hypothesis were true. If the observed counts are significantly different from the expected counts, then you can conclude that the null hypothesis is not true and that there is a difference between the variables!

Tying Into Chi-Squares
Now that we've added more context on why expected counts play a role in chi-square distributions, let's briefly touch upon the chi-square statistic.
The chi-square statistic is a measure of the difference between the observed counts and the expected counts in a statistical test. It is calculated by summing the squared differences between the observed and expected counts, divided by the expected counts, for each category.
The chi-square statistic is used to determine whether there is a significant difference between the observed counts and the expected counts, which would indicate that the null hypothesis is not true. The larger the chi-square statistic, the greater the difference between the observed and expected counts and the less likely it is that the difference is due to chance.
To determine whether the chi-square statistic is statistically significant, you would use a chi-square table or a computer program to calculate the p-value, which is a measure of the likelihood that the observed difference between the variables occurred by chance. If the p-value is below a certain threshold (e.g., 0.05), then you can conclude that there is a significant difference between the observed and expected counts and that the null hypothesis is not true.
Chi-Square Distributions
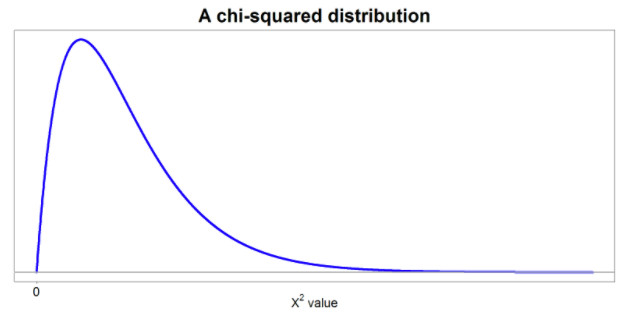
The chi-square distribution is a continuous probability distribution that is used to describe the distribution of a chi-square statistic. It has only positive values and is skewed to the right as shown in the image above, meaning that it is more heavily concentrated on the left side of the distribution.
The chi-square distribution is defined by a parameter called the degrees of freedom, which is a measure of the number of independent pieces of information that are used to calculate the chi-square statistic. The degrees of freedom for a chi-square test are equal to the number of categories minus 1. As the degrees of freedom increase, the skew of the chi-square distribution becomes less pronounced and the distribution becomes more symmetric.
Goodness of Fit
The first variation of a chi-squared test we will run is a chi-square goodness of fit test!
A chi-square goodness of fit (GOF) test is a statistical test that is used to determine whether the observed frequencies of a categorical variable differ significantly from a reference distribution. It is used to evaluate the fit of one categorical variable with multiple categories (e.g., a variable with more than two categories). In other words, a GOF test is used when evaluating the fit of one categorical variable with multiple categories. In previous units where we only observed one categorical variable, we were limited to two categories (so only binary examples).
For instance, we could look at a group of people and whether they answered yes or no, but we could not determine if they answered on a scale of 1 to 5. Since a scale of 1 to 5 would have 5 categories that participants could fall into, we could not perform a 1 Prop Z Test, so we would have to use something a bit more complex, like a chi-squared goodness of fit test.
Parameters
It is important to specify what our parameters are when performing inference. In the case of chi-squared GOF tests, we will have multiple population proportions that we are trying to check against a claim.
For example, if we survey a group of people on their scale of happiness 1-5 with 5 being the happiest and we have a claim that says:
- 10% said they were unhappy (1),
- 15% said they were somewhat unhappy (2),
- 28% said they were sometimes happy and sometimes sad (3),
- 30% said they were happy (4), and
- 17% said they were always happy (5)
Then our parameter we would be testing would be the true proportion of 1s, 2s, 3s, 4s and 5s.
Hypotheses
Null Hypothesis
Just as with any inference test, we must have both a null hypothesis and an alternate hypothesis. Our null hypothesis is generally what we would expect to happen if everything goes according to plan. There is nothing different going on than what our original claim was.
In the example of our happiness scale of 1-5, our null hypothesis would be as follows:
H0: p1 = 0.1
p2 = 0.15

p3 = 0.28

p4 = 0.3

p5 = 0.17
It is very important when writing our hypotheses to include context. In the example that we have just done, adding a subscript of 1, 2, 3, 4, or 5 gives us context since the problem was dealing with a survey score of 1 to 5. It is also a good idea to identify p1=true proportion of people who rated 1 as their happiness score, etc. for other scores.
Alternate Hypothesis
Our null hypothesis is normally very simple. It is best to just state that at least one of the proportions in our null hypothesis is incorrect. Since all of our proportions add up to 100%, one of our null proportions being incorrect leads to others being incorrect as well.
For example, on the happiness scale problem as noted above, our alternate hypothesis would be:
Ha: At least one of the proportions measuring people’s happiness is incorrect.
As always, context is key and can cause points to be docked off in FRQs!
Conditions
Chi-squared tests require two similar conditions as previous inference tests:
- Our sample must be random
- 10% rule: Our population must be at least 10x our sample
Instead of checking for a normal distribution, we have to make sure that our expected counts are at least 5.
In our happiness scale example, we would take our sample size and multiply by 0.1, 0.15, 0.28, 0.3 and 0.17 to ensure that we would expect to have at least 5 fall into each category.
If performing an experiment by random assignment of treatments, the independence condition is assumed (10% condition) and the random assignment suffices for the random condition.
Example
A recent survey established that when choosing their favorite between Harry Potter, Lord of the Rings and Star Wars, the answers were the same with 1/3 picking each of the series.
To test this claim, a random sample of 2500 US adults was surveyed about their favorite movie/book series. To check this test, write your hypotheses and check conditions for inference.
Hypotheses and Parameter
H0: pHP = 0.33, pSW = 0.33, pLOTR = 0.33
Ha: At least one of the proportions of favorite movie/book series is incorrect.
pHP=true proportion of people who prefer Harry Potter,
pSW=true proportion of people who prefer Star Wars,
pLOTR=true proportion of people who prefer Lord of the Rings
Conditions
- Random: “A random sample of 2500 US adults” (quote the problem)
- Independence: It is reasonable to believe that there are 25,000 adults in the US (10% condition)
- Large Counts: 2500(0.33)=825>5 (same for all three proportions)
In the next section, we will finish the problem by going through and calculating our test statistic and p-value based on our actual counts from our sample.
Vocabulary
The following words are mentioned explicitly in the College Board Course and Exam Description for this topic.
| Term | Definition |
|---|---|
| alternative hypothesis | The claim that contradicts the null hypothesis, representing what the researcher is trying to find evidence for. |
| categorical data | Data that represents categories or groups rather than numerical measurements, such as colors, types, or classifications. |
| chi-square distributions | Probability distributions used to test the goodness of fit between observed and expected categorical data, characterized by positive values and right skewness. |
| chi-square statistic | A test statistic that measures the distance between observed and expected counts relative to the expected counts. |
| chi-square test | A statistical test used to determine whether observed frequencies of categorical data match expected frequencies based on a hypothesized distribution. |
| degrees of freedom | A parameter of the t-distribution that affects its shape; as degrees of freedom increase, the t-distribution approaches the normal distribution. |
| distribution of proportions | The way in which proportions are spread across the categories of a categorical variable. |
| expected count | The theoretical frequency in each cell of a contingency table that would be expected if the null hypothesis of independence or homogeneity were true. |
| goodness of fit | A statistical test that determines how well observed data match the expected distribution specified by a hypothesis. |
| independence | The condition that observations in a sample are not influenced by each other, typically ensured through random sampling or randomized experiments. |
| null hypothesis | The initial claim or assumption being tested in a hypothesis test, typically stating that there is no effect or no difference. |
| null proportion | The hypothesized proportion for each category under the null hypothesis in a chi-square goodness of fit test. |
| observed count | The actual frequency or number of observations in each cell of a contingency table from the collected data. |
| proportion | A part or share of a whole, expressed as a fraction, decimal, or percentage. |
| random sample | A sample selected from a population in such a way that every member has an equal chance of being chosen, reducing bias and allowing for valid statistical inference. |
| randomized experiment | A study design where subjects are randomly assigned to treatment groups to establish cause-and-effect relationships. |
| sample size | The number of observations or data points collected in a sample, denoted as n. |
| sampling without replacement | A sampling method in which an item selected from a population cannot be selected again in subsequent draws. |
| statistical inference | The process of drawing conclusions about a population based on data collected from a sample. |
Frequently Asked Questions
How do I calculate expected counts for a chi-square goodness of fit test?
Expected counts are just the counts you’d expect if the null hypothesis about proportions is true. For each category: expected count = n × (null proportion for that category). Example: if n = 200 and H0 says p = 0.30 for Category A, expected = 200 × 0.30 = 60. Use those expected counts in the chi-square statistic χ² = Σ (observed − expected)² / expected (formula appears on the AP formula sheet). Quick checks for AP exam: make sure data come from a random sample (or randomized experiment) and that when sampling without replacement n ≤ 10% of the population. Also check the large-counts rule: a conservative rule is all expected counts > 5. For more on setting up goodness-of-fit tests see the Topic 8.2 study guide (https://library.fiveable.me/ap-statistics/unit-8/setting-up-chi-square-goodness-fit-test/study-guide/2W5HT2MbSAG4Ty1buvCd). For extra practice, try problems at (https://library.fiveable.me/practice/ap-statistics).
What's the difference between chi-square goodness of fit and chi-square independence tests?
Goodness-of-fit tests whether one categorical variable follows a specified distribution (null gives proportions for each category). You compute expected counts as n·p for each category, χ² = Σ((Obs − Exp)²/Exp), and df = k − 1 (k = # categories). Chi-square independence (or homogeneity) uses a two-way table to test whether two categorical variables are related (independence) or whether several groups have the same distribution (homogeneity). Expected counts come from row×column totals / grand total, df = (r − 1)(c − 1). Common CED checks apply to both: data from a random sample or randomized experiment, 10% condition when sampling without replacement, and all expected counts ≳ 5 for the χ² approximation to be reliable. On the AP exam, pick goodness-of-fit for one categorical variable (Topic 8.2) and independence/homogeneity for two-way tables (Topic 8.5); see the Topic 8.2 study guide (https://library.fiveable.me/ap-statistics/unit-8/setting-up-chi-square-goodness-fit-test/study-guide/2W5HT2MbSAG4Ty1buvCd) and Unit 8 overview (https://library.fiveable.me/ap-statistics/unit-8). For extra practice, use Fiveable’s practice problems (https://library.fiveable.me/practice/ap-statistics).
When do I use a chi-square test instead of a z-test or t-test?
Use a chi-square test when you’re working with counts for one categorical variable and you want to test whether the distribution of counts matches some specified proportions (goodness-of-fit) or whether categories are independent/in the same distribution (homogeneity/independence). That matches the CED: “chi-square test for goodness of fit” for one categorical variable (VAR-8.C.1). Compute expected counts as n·p (VAR-8.D.1), then χ² = Σ((obs − exp)²/exp) (VAR-8.A.2). Check conditions: random sample, n ≤ 10% of population if without replacement, and all expected counts > 5 for accuracy (VAR-8.E.1). Use z- or t-tests when your statistic is a sample mean or a single/paired proportion difference and the sampling distribution is approximately normal (z for large-sample proportions or known σ; t for means with unknown σ). For more on chi-square setup and examples, see the Topic 8.2 study guide (https://library.fiveable.me/ap-statistics/unit-8/setting-up-chi-square-goodness-of-fit-test/study-guide/2W5HT2MbSAG4Ty1buvCd) and Unit 8 overview (https://library.fiveable.me/ap-statistics/unit-8). For extra practice, try the AP problems on Fiveable (https://library.fiveable.me/practice/ap-statistics).
What's the formula for the chi-square test statistic and how do I use it?
Formula: Pearson’s chi-square statistic is χ² = Σ (observed − expected)² / expected, where “expected” = n · p (the count your null hypothesis predicts for each category). How to use it (quick steps): 1. State H0 with null proportions for each category and Ha: at least one proportion differs. 2. Compute expected counts = n·p for every category (CED: VAR-8.D.1). 3. Check conditions: random sample, n ≤ 10% of population if sampling without replacement, and all expected counts > 5 (conservative) (CED: VAR-8.E.1). 4. Calculate χ² = Σ (O−E)²/E across categories (CED: VAR-8.A.2—this measures distance between observed & expected). 5. Degrees of freedom = k − 1 (k = number of categories). 6. Find p-value from the chi-square distribution (right-skewed; larger χ² → smaller p). Compare p to α and conclude (reject H0 if p < α). For AP-aligned help, see the Topic 8.2 study guide (https://library.fiveable.me/ap-statistics/unit-8/setting-up-chi-square-goodness-fit-test/study-guide/2W5HT2MbSAG4Ty1buvCd), the Unit 8 overview (https://library.fiveable.me/ap-statistics/unit-8), and tons of practice problems (https://library.fiveable.me/practice/ap-statistics).
I'm confused about null and alternative hypotheses for goodness of fit - can someone explain?
Think of a goodness-of-fit test as checking whether the observed counts match a specific distribution. Your null hypothesis (H0) gives the specified proportions for every category—e.g., H0: predicted proportions = 0.25, 0.25, 0.25, 0.25 (or generally p1 = p1,0; p2 = p2,0; …). Expected counts = n · p (CED VAR-8.D.1). The alternative (Ha) is not a specific list of different proportions; it’s the broad statement that at least one category’s true proportion differs from what H0 says (CED VAR-8.B.1). When you set up the test also check conditions: random sample/experiment and 10% rule, and all expected counts > 5 for accuracy (CED VAR-8.E.1). The test statistic is χ² = Σ[(observed − expected)²/expected] (CED VAR-8.A.2), with df = number of categories − 1. For more examples and a guided walkthrough, see the Topic 8.2 study guide (https://library.fiveable.me/ap-statistics/unit-8/setting-up-chi-square-goodness-fit-test/study-guide/2W5HT2MbSAG4Ty1buvCd). For extra practice, try problems at (https://library.fiveable.me/practice/ap-statistics).
How do I know if my expected counts are large enough to do the chi-square test?
Check the independence conditions first: your data must come from a random sample or randomized experiment, and if sampling without replacement check n ≤ 10% of N. Then check the large-counts condition from the CED: a conservative rule is that every expected count = n·p (for each category) should be greater than 5. If all expected counts > 5, the chi-square goodness-of-fit approximation is considered accurate enough for the test and p-value from the χ² distribution. If one or more expected counts ≤ 5, don’t just run the test—combine similar categories to raise expected counts or use a simulation/randomization approach (or a different exact method) so your inference is valid. For more guide steps and examples, see the Topic 8.2 study guide (https://library.fiveable.me/ap-statistics/unit-8/setting-up-chi-square-goodness-fit-test/study-guide/2W5HT2MbSAG4Ty1buvCd) and the Unit 8 overview (https://library.fiveable.me/ap-statistics/unit-8). For extra practice, try problems at (https://library.fiveable.me/practice/ap-statistics).
What does it mean when they say "at least one proportion is not as specified" in the alternative hypothesis?
When the alternative hypothesis says “at least one proportion is not as specified,” it means the null gives specific proportions for every category (p1, p2, …), and the alternative just says those proportions aren’t all correct—at least one category’s true proportion differs from the null. It doesn’t tell you which category or how many are different; the chi-square goodness-of-fit test only detects whether the observed counts deviate enough overall from the expected counts (expected = n·p under H0). Remember: the chi-square statistic sums (observed − expected)^2/expected across categories, and the test uses df = k − 1. Before you infer, check AP conditions: random sample, 10% rule when sampling without replacement, and all expected counts > 5 for the large-counts rule (CED VAR-8.*). For extra review, see the Topic 8.2 study guide (https://library.fiveable.me/ap-statistics/unit-8/setting-up-chi-square-goodness-fit-test/study-guide/2W5HT2MbSAG4Ty1buvCd) and practice problems (https://library.fiveable.me/practice/ap-statistics).
Can someone walk me through the steps of setting up a chi-square goodness of fit test?
Start by stating hypotheses: H0 gives the null proportions for each category (p1, p2, …, pk); Ha says at least one proportion differs. Calculate expected counts: expected = n·(null proportion) for each category (CED VAR-8.D.1). Check conditions: data from a random sample or experiment; if sampling without replacement, n ≤ 10% of N; and all expected counts should be > 5 (conservative rule) so the chi-square approximation is valid (VAR-8.E.1). Compute the chi-square statistic: χ² = Σ (observed − expected)² / expected (VAR-8.A.2). Degrees of freedom = k − 1. Use the χ² distribution (right-skewed) to find the p-value and compare to α: if p ≤ α reject H0 (VAR-8.A.3, VAR-8.B.1). On the AP exam you’ll use the formula/table or calculator to get the p-value; formulas/tables are provided. For a quick refresher, see the Fiveable study guide for Topic 8.2 (https://library.fiveable.me/ap-statistics/unit-8/setting-up-chi-square-goodness-fit-test/study-guide/2W5HT2MbSAG4Ty1buvCd).
Why do all my expected counts have to be greater than 5?
Short answer: because the chi-square test’s math assumes the test statistic follows a chi-square distribution only when counts are “large enough,” and the usual conservative rule the CED gives is that every expected count > 5. If expected counts are too small the chi-square approximation is poor, so the p-value and conclusions can be misleading. Why that matters: the chi-square statistic χ² = Σ((obs − exp)²/exp) relies on approx. sampling behavior that becomes more accurate as counts grow (the distribution is positive and right-skewed but gets less skewed with more degrees of freedom and larger counts—VAR-8.A.3 and VAR-8.E.1.b). The CED therefore asks you to check expected = n·p and that all expected counts > 5 before using the chi-square test (Topic 8.2/8.3). If some expected counts ≤ 5: combine similar categories if that makes sense, collect more data, or use a simulation/Monte Carlo or exact (multinomial) method instead. For quick review, see the Topic 8.2 study guide (https://library.fiveable.me/ap-statistics/unit-8/setting-up-chi-square-goodness-fit-test/study-guide/2W5HT2MbSAG4Ty1buvCd) and practice questions (https://library.fiveable.me/practice/ap-statistics).
What's the 10% rule for chi-square tests and when do I need to check it?
The 10% rule is part of the independence condition for chi-square inference: when your sample is taken without replacement from a finite population, you should check that n ≤ 0.10·N so observations can be treated as (approximately) independent. You only need to check it when the sample is a sizable fraction of the population (i.e., sampling without replacement). If you have a random sample or randomized experiment from a very large population, the rule will usually hold automatically. Also remember the other chi-square condition: all expected counts should be > 5 (a conservative “large counts” check) before using the chi-square goodness-of-fit test (VAR-8.E in the CED). For a quick refresher on setting up these checks and calculating expected counts (n·p), see the Topic 8.2 study guide (https://library.fiveable.me/ap-statistics/unit-8/setting-up-chi-square-goodness-fit-test/study-guide/2W5HT2MbSAG4Ty1buvCd). For more practice problems, try Fiveable’s practice page (https://library.fiveable.me/practice/ap-statistics).
How do I find degrees of freedom for a goodness of fit test?
For a chi-square goodness-of-fit test, degrees of freedom tell you which chi-square curve to use. The basic rule is: df = (number of categories) − 1 So if you have 4 categories, df = 4 − 1 = 3. If you estimated any parameters from the data (for example, you fit a distribution and estimated one probability), subtract the number of estimated parameters: df = k − 1 − (number estimated). Why it matters: the df affect the shape of the chi-square distribution (less skew as df grows) and which critical value or p-value you read from the chi-square table. Don’t forget the conditions: expected counts should be large (conservative rule: all expected > 5) and data must be from a random sample (CED VAR-8.E). For a quick refresher, see the Topic 8.2 study guide (https://library.fiveable.me/ap-statistics/unit-8/setting-up-chi-square-goodness-fit-test/study-guide/2W5HT2MbSAG4Ty1buvCd) and practice problems (https://library.fiveable.me/practice/ap-statistics).
I don't understand how to write the hypotheses when there are multiple categories - help?
Think of the null as a full set of specified proportions and the alternative as “one or more are different.” Write H0 by listing the null proportion for every category; write Ha as that at least one pi is not as specified. Short template: - H0: p1 = p1,0, p2 = p2,0, …, pk = pk,0 (these are the null proportions) - Ha: At least one pi ≠ pi,0 Example (4 flavors): H0: p(vanilla)=0.25, p(chocolate)=0.35, p(strawberry)=0.20, p(mint)=0.20. Ha: At least one proportion differs from the values in H0. Use these H0 proportions to compute expected counts = n · p (CED VAR-8.A.1 and VAR-8.D.1). Check conditions: random sample, 10% rule if without replacement, and all expected counts > 5 (CED VAR-8.E.1). For more on wording, examples, and practice problems, see Fiveable’s Topic 8.2 study guide (https://library.fiveable.me/ap-statistics/unit-8/setting-up-chi-square-goodness-fit-test/study-guide/2W5HT2MbSAG4Ty1buvCd) and Unit 8 overview (https://library.fiveable.me/ap-statistics/unit-8). Practice problems: (https://library.fiveable.me/practice/ap-statistics).
What's the difference between observed counts and expected counts in chi-square?
Observed counts are the actual numbers you collect in each category—what you saw in the sample. Expected counts are what you would expect to see in each category if the null hypothesis were true: expected = n · (null proportion) for each category (CED VAR-8.D.1). Chi-square looks at how far observed and expected differ: χ² = Σ((observed − expected)² / expected) (CED VAR-8.A.2). Large differences make χ² big and suggest the null proportions aren’t right (CED VAR-8.B.1). Before relying on the test, check conditions: data from a random sample, 10% rule if sampling without replacement, and the conservative large-counts rule that all expected counts > 5 (CED VAR-8.E.1). For a quick refresher on setting up expected counts and examples, see the Topic 8.2 study guide (https://library.fiveable.me/ap-statistics/unit-8/setting-up-chi-square-goodness-fit-test/study-guide/2W5HT2MbSAG4Ty1buvCd). For more practice, try problems at (https://library.fiveable.me/practice/ap-statistics).
How do I use my calculator to find the chi-square test statistic?
Short answer: enter observed and expected counts into lists, compute (O−E)^2/E for each category, then sum those values to get χ². Use df = k − 1 (k = # categories) and get the p-value with the chi-square CDF on your calculator. TI-83/84 steps (works on most models): 1. Stat → Edit → put Observed counts in L1 and Expected counts in L2 (expected = n·p for each category). 2. In L3 enter the formula: (L1−L2)^2/L2—press 2nd → L1, −, 2nd → L2, ^2, ÷, 2nd → L2, ENTER. 3. Stat → Calc → 1-Var Stats on L3 (or just 2nd → LIST → MATH → sum( L3 )) to get χ² = sum(L3). 4. Degrees of freedom df = k − 1. For p-value use 2nd → DISTR → chi2cdf(lower, upper, df). Upper tail p = chi2cdf(χ², 1E99, df) (or p = 1 − chi2cdf(0, χ², df)). Don’t forget AP checks: data must be random, n ≤ 10% N if applicable, and all expected counts > 5 for the test to be reliable (CED VAR-8.E). For a step-by-step review of these ideas, see the Topic 8.2 study guide (https://library.fiveable.me/ap-statistics/unit-8/setting-up-chi-square-goodness-fit-test/study-guide/2W5HT2MbSAG4Ty1buvCd). For extra practice problems across Unit 8, try Fiveable’s practice page (https://library.fiveable.me/practice/ap-statistics).
Why are chi-square distributions always skewed right and positive?
Because the chi-square statistic is a sum of squared terms, its values can never be negative. Each term is (observed − expected)^2 / expected, so every piece is ≥ 0 and squaring removes sign information—that forces the whole distribution to live on the positive side. Squaring also makes large deviations rarer but more extreme, which piles probability near 0 and gives a long right tail (right skew). Degrees of freedom control how much tail you get: with small df the distribution is very skewed right; as df increases the shape becomes more symmetric and looks more like a normal. That’s why the CED says chi-square distributions are positive and skewed right, and why the skew lessens with increasing df (see Topic 8.2 study guide for more: https://library.fiveable.me/ap-statistics/unit-8/setting-up-chi-square-goodness-fit-test/study-guide/2W5HT2MbSAG4Ty1buvCd). For practice, try problems on the Unit 8 page (https://library.fiveable.me/ap-statistics/unit-8) or the practice bank (https://library.fiveable.me/practice/ap-statistics).