As you recall from Unit 7.3, a statistical claim is any belief that any population is equal (or not equal) to a given number or proportion. In dealing with two populations, our statistical claim is generally regarding whether these two populations are the same or different. Our null statistical claim when dealing with two different populations is that they are not different. In other words, their means are the same.
Making a Conclusion
When given a confidence interval and making a conclusion, there is a preset template that we can use that helps us to be sure to include all of the vocabulary necessary to score well on the AP Statistics exam.

Template
Our template should go as follows:
- "We are % confident that the true difference in population means between _______ and _______ (context of problem) is (, ___).
- "In repeated random sampling with the same sample size, approximately C% of confidence intervals created will capture the difference of population means (add more about context).
As with any AP Statistics Free Response question, it is always imperative that your answer includes context of the problem given. After all, a comprehensive interpretation for a confidence interval for the difference of two population means should include a reference to the samples taken and details about the populations they represent.
When testing for the difference in two populations, it is also important to use that interval to test the claim that the two populations are the same. If the two populations are statistically "the same," 0 will be included in your interval. If after completing your interval, you do not have 0 in your interval, there is reason to believe that your two populations do, in fact, have different means.
Finishing Our Apples to Apples Example
Let's finish our example with the green apples and red apples. 🍏🍎
In Unit 7.5, we concluded that our confidence interval for the difference in our two color apples was (0.408, 0.592). Our conclusion should go as follows:
"We are 95% confident that the true difference in the population means of the weights of green apples and red apples is between (0.408, 0.592). Since 0 is not included in our interval, we have significant evidence that the weights of green apples and red apples are in fact different."
Notice since 0 was not in our interval, that tells us, with 95% confidence, that there is some sort of difference in our two population means.
Relating Confidence Intervals and Sample Sizes
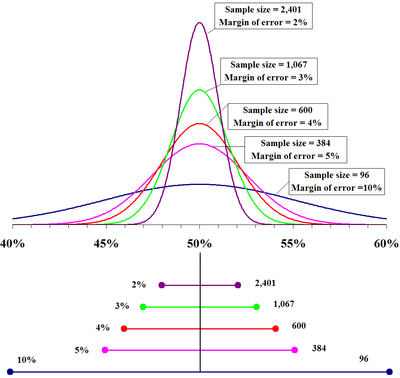
When all other things remain the same, the width of the confidence interval for the difference of two means tends to decrease as the sample sizes increase**.** That's right: the width of the confidence interval for the difference of two means (also known as the margin of error) is inversely proportional to the sample size.
Recall that the confidence interval represents the range of values within which the true population parameter is likely to fall, with a certain level of confidence. In the case of the difference of two means, the confidence interval is calculated by taking the difference between the two sample means and adding and subtracting the margin of error. The margin of error is calculated based on the standard error of the difference between the means and the desired level of confidence.
Increasing the sample size allows for a more precise estimate of the population parameter, which results in a narrower confidence interval and a smaller margin of error.
🎥 Watch: AP Stats - Inference: Confidence Intervals for Means
Vocabulary
The following words are mentioned explicitly in the College Board Course and Exam Description for this topic.
| Term | Definition |
|---|---|
| confidence interval | A range of values, calculated from sample data, that is likely to contain the true population parameter with a specified level of confidence. |
| difference in sample means | The result of subtracting one sample mean from another sample mean, calculated as x̄₁ - x̄₂. |
| difference of population means | The difference between the mean values of two distinct populations, calculated as μ₁ - μ₂. |
| population means | The average values of two distinct populations being compared, denoted as μ₁ and μ₂. |
| random sampling | A method of selecting samples from a population where each member has an equal chance of being chosen, ensuring the sample is representative of the population. |
| sample size | The number of observations or data points collected in a sample, denoted as n. |
| width of a confidence interval | The range or span of a confidence interval, calculated as the difference between the upper and lower bounds of the interval. |
Frequently Asked Questions
How do I interpret a confidence interval for the difference of two means?
A confidence interval for μ1 − μ2 gives a range of plausible values for the difference between the two population means based on your samples. Say you have a 95% CI (−2.37, 0.37) for (northern − southern). Interpret it like this: “Based on these samples, we are 95% confident the true difference in population mean response times (northern − southern) is between −2.37 and 0.37 minutes.” That means about 95% of such CIs from repeated similar samples would capture the true difference (UNC-4.Z.1), and your statement should explicitly mention the samples and the populations they represent (UNC-4.Z.2). How you justify a claim: if the CI does not contain 0, it provides evidence of a difference (statistically significant). If it contains 0, you don’t have evidence of a difference. Remember conditions (random/independent samples, appropriate t or paired method), and that larger sample sizes narrow the CI (UNC-4.AB.1). For a focused study guide, see Fiveable’s topic page (https://library.fiveable.me/ap-statistics/unit-7/justifying-claim-about-difference-two-means-based-on-confidence-interval/study-guide/2aDCrLIsL7MCjYK5Wn8w). For unit review and tons of practice problems, check the Unit 7 overview (https://library.fiveable.me/ap-statistics/unit-7) and practice set (https://library.fiveable.me/practice/ap-statistics).
What's the formula for finding a confidence interval for the difference between two population means?
Use a two-sample t interval. The general formula is (x̄1 − x̄2) ± t* · SE where SE = sqrt( s1^2/n1 + s2^2/n2 ). t* is the t critical value for your confidence level with degrees of freedom found by the Welch–Satterthwaite approximation (or use the exact df shown on your calculator/computer). This is the unpooled (Welch) interval; if you can assume equal population variances, use the pooled s_p and SE = s_p·sqrt(1/n1 + 1/n2) instead. Conditions: independent random samples, approx. normal populations or large n (CLT), and independence between samples. Interpret the interval in context (e.g., “we’re 95% confident the difference μ1−μ2 is between …”). The AP exam provides formula/tables; you may use the t table or calculator and should state the confidence level interpretation (C% of such intervals capture the true difference). For the Topic 7.7 study guide, see (https://library.fiveable.me/ap-statistics/unit-7/justifying-claim-about-difference-two-means-based-on-confidence-interval/study-guide/2aDCrLIsL7MCjYK5Wn8w). For broader review and practice questions, visit (https://library.fiveable.me/ap-statistics/unit-7) and (https://library.fiveable.me/practice/ap-statistics).
When do I use a confidence interval vs a hypothesis test for comparing two means?
Use a confidence interval when you want an estimated range for the difference (μ1 − μ2) and to see which values are plausible; use a hypothesis test when you need a yes/no decision about a specific claim (e.g., μ1 − μ2 = 0). Practically on the exam: construct a two-sample t confidence interval (Welch or pooled if justified) to interpret “I’m C% confident the difference (group1 − group2) is between a and b” (UNC-4.Z.1, UNC-4.Z.2). To justify a claim from a CI, check whether the null value (often 0) lies inside the interval: if 0 is not in the CI you have evidence the means differ; if 0 is inside the CI you don’t have strong evidence (UNC-4.AA.1). Always verify conditions: independent random samples (or paired if appropriate), approximate normality or large n, and note sample size effects on interval width (UNC-4.AB.1). For AP review, see the Topic 7.7 study guide (https://library.fiveable.me/ap-statistics/unit-7/justifying-claim-about-difference-two-means-based-on-confidence-interval/study-guide/2aDCrLIsL7MCjYK5Wn8w), the Unit 7 overview (https://library.fiveable.me/ap-statistics/unit-7), and practice problems (https://library.fiveable.me/practice/ap-statistics).
I'm confused about how to justify a claim using a confidence interval - can someone explain this step by step?
Step-by-step: 1. State the claim in context about the difference of population means (μ1 − μ2). Be explicit which mean is subtracted from which. 2. Report the confidence interval and level (e.g., 95% CI for μ1 − μ2 is (a, b)). 3. Compare the interval to the null value 0: if 0 is NOT in (a, b), the CI gives evidence the population means differ in the direction shown (both endpoints positive → μ1>μ2; both negative → μ1<μ2). If 0 is inside, the CI does NOT provide strong evidence of a difference. (This is UNC-4.AA.1 & UNC-4.Z.1.) 4. Tie it to samples/populations: “Based on these random samples, we are C% confident that the difference in population mean [context] (μ1 − μ2) is between a and b” (UNC-4.Z.2). 5. Check and mention conditions: independent random samples, sampling distribution approximately normal (or large n), correct SE used (pooled vs Welch). 6. Note practicality: larger n → narrower CI (UNC-4.AB.1). For more examples and practice, see the topic study guide (https://library.fiveable.me/ap-statistics/unit-7/justifying-claim-about-difference-two-means-based-on-confidence-interval/study-guide/2aDCrLIsL7MCjYK5Wn8w) and Unit 7 review (https://library.fiveable.me/ap-statistics/unit-7). Practice problems: (https://library.fiveable.me/practice/ap-statistics).
What does it mean when a confidence interval for the difference of means includes zero?
If a confidence interval for μ1 − μ2 includes 0, it means that 0 is a plausible value for the true difference between the two population means given your samples. In plain terms: the interval contains values that say “no difference,” so you do not have strong evidence (at that confidence level C%) to claim the populations differ. Use context: name the two samples and populations and say you’re C% confident the true difference (population A − population B) lies in that interval (UNC-4.Z.2). Remember: zero is the null value for “no difference.” If the CI excludes 0, that supports a claim of a difference; if it includes 0, you fail to support that claim. Also keep practical significance in mind—even if 0’s included, the interval might rule out large differences. Bigger sample sizes narrow the interval (UNC-4.AB.1). For more AP-aligned explanation, see the Topic 7.7 study guide (https://library.fiveable.me/ap-statistics/unit-7/justifying-claim-about-difference-two-means-based-on-confidence-interval/study-guide/2aDCrLIsL7MCjYK5Wn8w) and more practice problems (https://library.fiveable.me/practice/ap-statistics).
How do I know if my confidence interval provides enough evidence to support a claim about two populations?
Look at where 0 (the “no difference” value) falls inside your two-sample confidence interval for μ1−μ2. If the CI does NOT contain 0, that interval provides evidence of a difference at that confidence level (e.g., a 95% CI that doesn’t include 0 supports a claim that the population means differ). If the entire interval is above 0, it supports μ1>μ2; if it’s entirely below 0, it supports μ1<μ2. If the CI contains 0, the interval does not provide sufficient evidence for a difference. Always state context (which populations, which direction), and verify conditions: random samples, independence (or paired differences if paired), and approximate normality or large n (use Welch t vs pooled when variances differ). Remember wider CIs from small n give weaker evidence; larger n narrows the interval (UNC-4.AB.1). Also recall the C% interpretation: about C% of such intervals would capture the true difference (UNC-4.Z.1, UNC-4.Z.2). For a targeted review see the Topic 7.7 study guide (https://library.fiveable.me/ap-statistics/unit-7/justifying-claim-about-difference-two-means-based-on-confidence-interval/study-guide/2aDCrLIsL7MCjYK5Wn8w) and more practice questions at (https://library.fiveable.me/practice/ap-statistics).
What's the difference between interpreting a single mean confidence interval and a difference of means confidence interval?
A single-mean CI gives a range of plausible values for one population mean µ. You’d say: “I’m C% confident the population mean (context) is between A and B,” and reference the sample that produced it. A difference-of-means CI gives a range for µ1 − µ2 (or µpaired) and you must keep the order and context: “I’m 95% confident the difference in population mean response times (north − south) is between −2.37 and 0.37 minutes” (UNC-4.Z.2). Key practical differences for AP exam answers: - Always state the populations and sample sources for each group (UNC-4.Z.2). - For a two-mean CI, check whether 0 is inside the interval: if 0 is not in the CI, the interval provides evidence of a difference (UNC-4.AA.1); if 0 is inside, you don’t have convincing evidence of a difference. - Width behavior: larger n1 or n2 shrinks the interval (UNC-4.AB.1). For more review see the Topic 7.7 study guide (https://library.fiveable.me/ap-statistics/unit-7/justifying-claim-about-difference-two-means-based-on-confidence-interval/study-guide/2aDCrLIsL7MCjYK5Wn8w) or the Unit 7 overview (https://library.fiveable.me/ap-statistics/unit-7). Practice problems: (https://library.fiveable.me/practice/ap-statistics).
How does sample size affect the width of a confidence interval for the difference of two means?
Bigger samples give you more precise CIs. For a two-sample mean interval the standard error is s.e. = sqrt(s1^2/n1 + s2^2/n2). The margin of error = t* × s.e., so when n1 and/or n2 increases the s.e. gets smaller and the interval gets narrower (all else equal). That’s exactly UNC-4.AB.1: bigger sample sizes → narrower CIs. Remember to tie this to interpretation on the exam (UNC-4.Z.2): a narrower CI gives a smaller range of plausible values for μ1 − μ2, which can make it easier to justify or reject a claim about a difference. Also keep the CI’s capture idea in mind: with the same sample size, about C% of such intervals will contain the true difference (UNC-4.Z.1). For more review on this Topic 7.7 idea, see the study guide (https://library.fiveable.me/ap-statistics/unit-7/justifying-claim-about-difference-two-means-based-on-confidence-interval/study-guide/2aDCrLIsL7MCjYK5Wn8w). For broader unit review and extra practice, check Unit 7 (https://library.fiveable.me/ap-statistics/unit-7) and the 1000+ practice problems (https://library.fiveable.me/practice/ap-statistics).
I don't understand what "northern - southern" means in the context of difference of means problems - help?
"northern − southern" just means the difference in the population means where you subtract the southern mean from the northern mean. So a confidence interval for (northern − southern) gives a range of plausible values for μ_north − μ_south. Key things to watch for on the AP exam (and in the CED): always state the populations and the subtraction order, include units, and interpret the interval in context (UNC-4.Z.2). Examples of how to read results: - CI = (−2.37, 0.37) minutes → you’re 95% confident the northern mean response time is between 2.37 minutes faster and 0.37 minutes slower than the southern mean. Because 0 is inside the interval, there’s not strong evidence of a real difference (the difference could be zero). - If the entire CI is positive, northern > southern; if entirely negative, northern < southern. Also remember: CI width shrinks with larger n (UNC-4.AB.1) and C% of such intervals would capture the true difference in repeated sampling (UNC-4.Z.1). For more examples and how to justify claims from a CI, see the topic study guide (https://library.fiveable.me/ap-statistics/unit-7/justifying-claim-about-difference-two-means-based-on-confidence-interval/study-guide/2aDCrLIsL7MCjYK5Wn8w) and practice problems (https://library.fiveable.me/practice/ap-statistics).
Can someone walk me through how to write a proper interpretation for a difference of means confidence interval?
Write two short sentences: one that interprets the interval, and one that uses it to support or reject the claim. 1) Interpretation template (use your sample labels and order): "Based on the random samples, I am 95% confident that the difference in the population mean (population 1 − population 2) is between A and B units." This cites UNC-4.Z.1 and UNC-4.Z.2—mention the samples and the populations they represent. 2) Justifying a claim: check whether the interval contains 0 (the null value). - If 0 is NOT in the interval, say: "Because 0 is not in the interval, the interval provides evidence that the population means differ; the data support the claim that the difference is (positive/negative) and is between A and B." (UNC-4.AA.1) - If 0 IS in the interval, say: "Because 0 is in the interval, the interval does not provide convincing evidence of a difference; the data are consistent with no difference." Also note sample-size effect: larger n → narrower CI (UNC-4.AB.1). For practice and more examples, see the topic study guide (https://library.fiveable.me/ap-statistics/unit-7/justifying-claim-about-difference-two-means-based-on-confidence-interval/study-guide/2aDCrLIsL7MCjYK5Wn8w) and the Unit 7 overview (https://library.fiveable.me/ap-statistics/unit-7).
When the confidence interval is (-2.37, 0.37), how do I know if there's a significant difference between the two means?
Because the interval (-2.37, 0.37) contains 0, you do NOT have statistical evidence of a difference between the two population means at that confidence level. A CI for (µ1 − µ2) that includes 0 means 0 is a plausible value for the true difference, so you cannot confidently say one mean is larger. When you answer on the AP, phrase it in context (e.g., “Based on these samples, we are C% confident the difference (northern − southern) is between −2.37 and 0.37 minutes, so 0 is plausible and there is not convincing evidence of a difference,” per UNC-4.Z and UNC-4.AA). Also note practical vs. statistical significance: even if not significant, values near −2.37 might be meaningful in context. Review the Topic 7.7 study guide (https://library.fiveable.me/ap-statistics/unit-7/justifying-claim-about-difference-two-means-based-on-confidence-interval/study-guide/2aDCrLIsL7MCjYK5Wn8w) and practice more at (https://library.fiveable.me/practice/ap-statistics).
What do I need to include when interpreting a confidence interval for difference of population means?
When you interpret a two-sample confidence interval for μ1 − μ2, include these pieces so your answer matches the CED: - The confidence level and the interval: e.g., “A 95% CI for (northern − southern) response time is (−2.37, 0.37) minutes.” - Clear identification of the populations and samples used (what the two groups are and that the interval is based on those samples). - Units and context (minutes, dollars, ppm, etc.). - The long-run meaning: “About 95% of such intervals from repeated random samples would capture the true difference” (UNC-4.Z.1). - Conclusion about the claim: say whether the interval provides evidence for the claim—if the CI excludes 0 it supports a nonzero difference; if it contains 0 it doesn’t provide convincing evidence (UNC-4.AA.1). - Note practical vs statistical significance and that larger sample sizes narrow the interval (UNC-4.AB.1). - Briefly state conditions/assumptions met (random samples, independence, appropriate t procedure or paired if needed). For more examples and wording to practice, see the Topic 7.7 study guide (https://library.fiveable.me/ap-statistics/unit-7/justifying-claim-about-difference-two-means-based-on-confidence-interval/study-guide/2aDCrLIsL7MCjYK5Wn8w), the Unit 7 overview (https://library.fiveable.me/ap-statistics/unit-7), and extra practice problems (https://library.fiveable.me/practice/ap-statistics).
How do I solve a problem where I need to justify whether one mean is greater than another using a confidence interval?
Look at the confidence interval for μ1 − μ2 and compare it to 0 (the “no difference” value). Rules you’ll use on the exam: - If the entire CI is greater than 0 (for example, 0.5 to 2.3), you have evidence that μ1 > μ2—you can justify the claim in context and say you’re C% confident the population difference (μ1 − μ2) is between those values. - If the entire CI is less than 0 (e.g., −3.0 to −0.2), you have evidence that μ1 < μ2. - If the CI contains 0 (e.g., −1.2 to 0.8), the data do not provide sufficient evidence to claim one mean is greater. When you justify, state the confidence level and refer to the populations/samples (UNC-4.Z.2, UNC-4.AA.1). Also check conditions (independent random samples or paired), and note larger n gives a narrower CI (UNC-4.AB.1). For step-by-step examples and AP-aligned practice, see the Topic 7.7 study guide (https://library.fiveable.me/ap-statistics/unit-7/justifying-claim-about-difference-two-means-based-on-confidence-interval/study-guide/2aDCrLIsL7MCjYK5Wn8w). For more review and practice problems, visit the Unit 7 overview (https://library.fiveable.me/ap-statistics/unit-7) and the practice set (https://library.fiveable.me/practice/ap-statistics).
Why does increasing sample size make the confidence interval narrower for difference of means?
Think of a CI as: point estimate ± (critical value) × (standard error). For a difference of two means the standard error is s.e. = sqrt(s1^2/n1 + s2^2/n2). When you increase n1 or n2 each term with 1/n gets smaller, so the whole standard error shrinks. With a smaller standard error the margin of error (critical value × s.e.) gets smaller, so the interval becomes narrower. Intuitively: bigger samples give more precise estimates of each mean, so their difference is estimated more precisely. That’s exactly UNC-4.AB in the CED. On the AP exam you’ll use that idea when interpreting C% capture rate and justifying claims from a CI (Topic 7.7). Want a quick refresher? Check the Topic 7.7 study guide (https://library.fiveable.me/ap-statistics/unit-7/justifying-claim-about-difference-two-means-based-on-confidence-interval/study-guide/2aDCrLIsL7MCjYK5Wn8w) or the Unit 7 overview (https://library.fiveable.me/ap-statistics/unit-7). Practice problems are at (https://library.fiveable.me/practice/ap-statistics).
I keep messing up the interpretation part - what exactly do I need to say about the samples and populations?
Say both what you did (the samples) and what you’re estimating (the population difference). Keep two clear sentences: one that describes the samples and one that interprets the interval for the population parameter. Template: - Sample sentence: “Based on random samples of n1 = __ from population 1 and n2 = __ from population 2, …” - CI sentence: “We are C% confident the difference in the population means (μ1 − μ2) is between a and b.” If the interval doesn’t contain 0, add: “Because 0 is not in the interval, this provides evidence the population means differ in context.” If it does contain 0, say it’s plausible the means are equal. Also mention assumptions briefly when relevant for AP scoring: samples were random/independent (or paired if appropriate), sample sizes, and conditions for a two-sample t-interval. Recall the CED language: “approximately C% of such intervals will capture μ1 − μ2” (UNC-4.Z.1) and include sample/population references (UNC-4.Z.2). For extra practice and examples see the Topic 7.7 study guide (https://library.fiveable.me/ap-statistics/unit-7/justifying-claim-about-difference-two-means-based-on-confidence-interval/study-guide/2aDCrLIsL7MCjYK5Wn8w), the Unit 7 overview (https://library.fiveable.me/ap-statistics/unit-7), and practice problems (https://library.fiveable.me/practice/ap-statistics).