In order to use the binomial distribution to model a random event, the event must meet the following four conditions:
- Binary: The possible outcomes of each trial can be classified as a success or a failure.
- Independent: Trials must be independent. That is, knowing the outcome of one trial must not tell us anything about the outcome of any other trial.
- Fixed number of trials: The number of trials n of the chance process must be fixed in advance.
- Same probability of success: There must be the same probability of success p on each trial.
(A mnemonic device that might help is BINS: binary, independent, number, same probability!)
If any of these conditions is not met, then the event cannot be modeled using the binomial distribution. For example, suppose you want to use the binomial distribution to model the number of heads in 10 flips of a biased coin that has a probability of heads of 0.8 on the first flip, 0.6 on the second flip, and so on. In this case, the probability of success is not the same on each trial, so the event cannot be modeled using the binomial distribution.
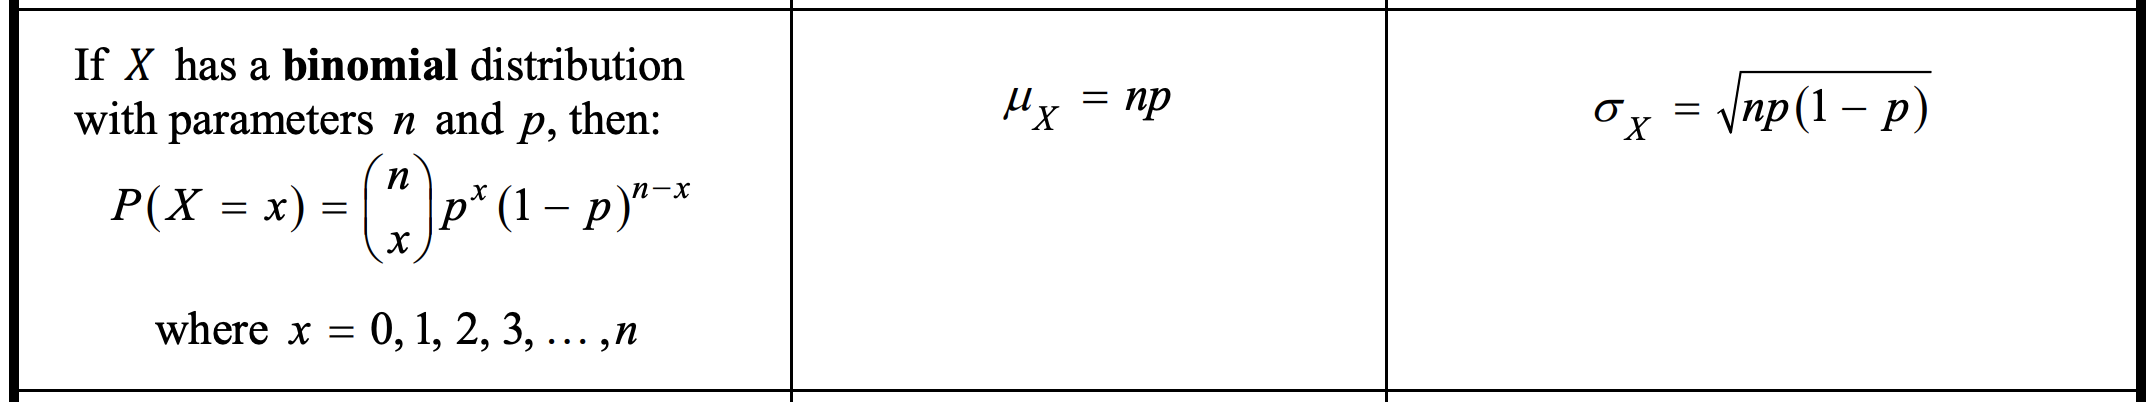
Describing Mean and Standard Deviation of Binomial Variables
Before proceeding, it's important to note that these formulae only apply in binomial settings, where the conditions for the binomial distribution are met. If the conditions for the binomial distribution are not met, then these formulae will not be appropriate for calculating the mean and standard deviation of the random variable.
- Mean -- The mean (expected value) of a binomial random variable X, which represents the number of successes in n independent trials with probability of success p, is given by: mean = E(X) = n * p
- Standard deviation -- The standard deviation of a binomial random variable X, which represents the number of successes in n independent trials with probability of success p, is given by: standard deviation = σx = sqrt(n * p * (1-p))

Binomial Distributions in Statistical Sampling
Another common rule of thumb used to determine whether a binomial model is appropriate for a random event is the 10% condition, which states that if you are taking a random sample of size n from a population of size N, and n is less than 10% of N (that is, n < 0.10N), then you can use a binomial model to describe the number of successes in the sample.
This rule is based on the assumption that the sample is representative of the population, and that the probability of success is the same in the sample as it is in the population. If these assumptions are not met, then the binomial model may not be appropriate, even if the sample size is less than 10% of the population size.
🎥 Watch: AP Stats - Probability: Random Variables, Binomial/Geometric Distributions
Vocabulary
The following words are mentioned explicitly in the College Board Course and Exam Description for this topic.
| Term | Definition |
|---|---|
| binomial distribution | A probability distribution that describes the number of successes in a fixed number of independent trials, each with the same probability of success. |
| mean | The average value of a dataset, represented by μ in the context of a population. |
| parameter | A numerical summary that describes a characteristic of an entire population. |
| probability | The likelihood or chance that a particular outcome or event will occur, expressed as a value between 0 and 1. |
| random variable | A variable whose value is determined by the outcome of a random phenomenon and can take on different numerical values with associated probabilities. |
| standard deviation | A measure of how spread out data values are from the mean, represented by σ in the context of a population. |
Frequently Asked Questions
How do I find the mean and standard deviation for a binomial distribution?
If X ~ Bin(n, p) (n independent Bernoulli trials with success probability p), the CED gives the parameters you need: - Mean (expected value): μ = np. - Standard deviation: σ = sqrt[np(1 − p)]. How to use/interpret: μ = the long-run average number of successes in n trials (e.g., if n = 20 and p = 0.3, μ = 6). σ tells you typical spread around that mean (same example: σ = sqrt(20·0.3·0.7) ≈ 2.05). Always state these with context (what a “success” is and units = number of successes) as UNC-3.D requires. AP tip: before treating a situation as binomial, check the binomial conditions (fixed n, two outcomes, same p, independent). For normal approximation to the binomial, use it only when np ≥ 10 and n(1 − p) ≥ 10 (apply continuity correction on the exam if asked). For a quick review, see the Topic 4.11 study guide (https://library.fiveable.me/ap-statistics/unit-4/parameters-for-binomial-distribution/study-guide/0ZX2eo84NRcGsg9O6xMT). For broader Unit 4 review: (https://library.fiveable.me/ap-statistics/unit-4). Practice more with problems at (https://library.fiveable.me/practice/ap-statistics).
What's the formula for binomial mean and variance that I need to memorize?
Memorize these and what they mean: - Mean (expected value) of a binomial: μ = np. (Interpretation: on average you expect np successes in n trials.) - Variance of a binomial: Var(X) = np(1 − p). Standard deviation: σ = sqrt(np(1 − p)). Make sure the situation meets the binomial conditions: fixed number of trials n, independent trials, two outcomes (success/failure), and constant success probability p. Always interpret your answer in context and with units (e.g., “about 3.6 students” or “3.6 successes per 10 trials”). The CED lists μ = np and σ = sqrt(np(1 − p)) under UNC-3.C. For a quick topic review see the Fiveable study guide (https://library.fiveable.me/ap-statistics/unit-4/parameters-for-binomial-distribution/study-guide/0ZX2eo84NRcGsg9O6xMT). For broader Unit 4 review and tons of practice problems, use (https://library.fiveable.me/ap-statistics/unit-4) and (https://library.fiveable.me/practice/ap-statistics).
When do I use np vs np(1-p) in binomial problems?
Use np when you need the expected number (mean) of successes in n Bernoulli trials: μ = np. Use np(1−p) when you need the variance (and √[np(1−p)] for the standard deviation) of that binomial random variable. Practical reminders for AP Stats (CED UNC-3.C / UNC-3.D): - If X ~ Binomial(n,p): mean μX = np (interpret as “on average you expect np successes”) and Var(X) = np(1−p), so SD = √[np(1−p)]. - For normal approximations and success–failure checks, you need both np and n(1−p) to be large enough (commonly ≥10) because the SD depends on np(1−p). - For sample proportions p̂, the SE = √[p(1−p)/n] (same 1−p factor shows up). For more examples and AP-aligned practice, see the Topic 4.11 study guide (https://library.fiveable.me/ap-statistics/unit-4/parameters-for-binomial-distribution/study-guide/0ZX2eo84NRcGsg9O6xMT) and browse extra practice questions (https://library.fiveable.me/practice/ap-statistics).
Can someone explain step by step how to calculate binomial parameters?
Quick steps to get the binomial parameters and related numbers (AP style): 1. Verify binomial conditions: fixed n trials, trials independent, two outcomes (success/failure), same success probability p each trial. If any fail, binomial model isn’t appropriate. 2. From context identify n (number of trials) and p (success probability). If given directly, you’re done. 3. If you need mean or SD, use the CED formulas: mean μ = np and standard deviation σ = sqrt[np(1 − p)]. Those are on the AP formula sheet. 4. Solve for missing pieces: - If you know n and p: μ = np and σ = sqrt[np(1−p)]. - If you know μ and n: p = μ/n. - If you know μ and σ: use σ^2 = μ(1−p) so p = 1 − (σ^2/μ). (Derivation: σ^2 = np(1−p) and μ = np → σ^2 = μ(1−p).) 5. Use these parameters for P(X = k) = C(n,k) p^k (1−p)^{n−k} or for normal approx when appropriate. For an AP review, see the Topic 4.11 study guide (https://library.fiveable.me/ap-statistics/unit-4/parameters-for-binomial-distribution/study-guide/0ZX2eo84NRcGsg9O6xMT) and grab extra practice problems at (https://library.fiveable.me/practice/ap-statistics).
I'm confused about the difference between n, p, and the mean in binomial distributions.
Think of a binomial as "n tries, each with the same chance p of success." - n = number of independent Bernoulli trials (fixed number of trials). Example: survey 10 people → n = 10. - p = probability of success on each trial (same for every trial). Example: if 30% prefer chocolate, p = 0.30. - mean (expected value) μ = np. It’s how many successes you expect on average. With n = 10 and p = 0.30, μ = 10(0.30) = 3. Also remember the standard deviation σ = sqrt(np(1−p))—for that example σ = sqrt(10·0.3·0.7) ≈ 1.45. Always check binomial conditions: fixed n, identical p each trial, independent trials. Interpret μ and probabilities in context and with units (“expected number of successes out of n”), per the CED (UNC-3.C and UNC-3.D). For a quick topic review and more practice problems, see the Fiveable study guide (https://library.fiveable.me/ap-statistics/unit-4/parameters-for-binomial-distribution/study-guide/0ZX2eo84NRcGsg9O6xMT) and tons of practice questions (https://library.fiveable.me/practice/ap-statistics).
How do I know if I should use the binomial formulas or something else?
Use the binomial formulas only when the situation meets the binomial conditions: fixed number of trials n, each trial is a Bernoulli (two outcomes: “success” or “failure”), constant success probability p, and trials are independent. If any of those fail, don’t use the binomial PMF. - If you have a binomial, use P(X = k) = C(n,k) p^k (1−p)^{n−k}, and parameters μ = np, σ = sqrt[np(1−p)] (CED UNC-3.C). - For sampling without replacement, check the 10% condition to justify independence. - If n is large and np and n(1−p) are both ≥ 10, you can use the normal approximation (with continuity correction on the exam) instead of summing binomial terms. - If outcomes aren’t simply success/failure, or p changes, use a different model (multinomial, geometric, empirical, etc.). Want quick checklists and examples? See the Topic 4.11 study guide (https://library.fiveable.me/ap-statistics/unit-4/parameters-for-binomial-distribution/study-guide/0ZX2eo84NRcGsg9O6xMT) and more unit review (https://library.fiveable.me/ap-statistics/unit-4). For extra practice, try problems at (https://library.fiveable.me/practice/ap-statistics).
What does it mean to interpret binomial parameters "in context" for FRQs?
Interpreting binomial parameters "in context" means you don’t just write np = 3—you explain what n, p, μ = np and σ = sqrt(np(1−p)) mean for the specific scenario on the FRQ. Say what a “success” is, what population or process the trials come from, and include units/words like “people,” “tests,” or “days.” For example: “With n = 10 customers and p = 0.3 (probability a customer buys coffee), the expected number μ = np = 3 means we expect about 3 customers to buy coffee per group of 10, on average. The standard deviation σ = sqrt(10·0.3·0.7) ≈ 1.45 customers, so the number of buyers typically varies by about 1.45 customers from the mean.” Also check binomial conditions (fixed n, independent trials, same p). AP graders expect this contextual wording (UNC-3.D.1)—show units and link μ and σ back to the real situation. For a short study guide, see the Topic 4.11 page (https://library.fiveable.me/ap-statistics/unit-4/parameters-for-binomial-distribution/study-guide/0ZX2eo84NRcGsg9O6xMT). For more practice, try Fiveable’s unit resources (https://library.fiveable.me/ap-statistics/unit-4) or the practice problem bank (https://library.fiveable.me/practice/ap-statistics).
Why is the standard deviation formula square root of np(1-p) and not just np(1-p)?
Think of a binomial as the sum of n independent Bernoulli trials (each trial = 1 for success, 0 for failure). For one Bernoulli trial the variance is p(1−p) (that measures variability squared, in “squared units”). Variances add for independent trials, so the variance of the sum X (number of successes) is n·p(1−p). Standard deviation is the square root of variance, so σX = sqrt[n·p(1−p)]. Why not just n·p(1−p)? Because n·p(1−p) is variance (units squared). Standard deviation must be in the same units as X (counts), so you take the square root. On the AP exam you should report mean μ = np and standard deviation σ = sqrt(np(1−p)) (CED UNC-3.C). For a refresher, see the Topic 4.11 study guide (https://library.fiveable.me/ap-statistics/unit-4/parameters-for-binomial-distribution/study-guide/0ZX2eo84NRcGsg9O6xMT) and more practice at (https://library.fiveable.me/practice/ap-statistics).
I keep forgetting - is the mean np or n times p times (1-p)?
The mean (expected value) of a binomial is np—not n p(1−p). Specifically, if X ~ Binomial(n, p) then μX = np and Var(X) = np(1−p), so the standard deviation is σX = √[np(1−p)] (this is exactly what the AP CED lists: UNC-3.C.1). Quick interpretation: μ = np is the long-run average number of successes in n trials (use units: “successes per n trials”). Make sure the binomial conditions hold (fixed n, independent trials, same success probability p) before using these formulas—the AP exam expects you to verify those conditions. Want a refresher or practice? See the Topic 4.11 study guide (https://library.fiveable.me/ap-statistics/unit-4/parameters-for-binomial-distribution/study-guide/0ZX2eo84NRcGsg9O6xMT) and try practice problems at (https://library.fiveable.me/practice/ap-statistics).
How do I solve word problems that ask for binomial mean and standard deviation?
First check the scenario is binomial: fixed number of trials n, each trial independent, two outcomes (success/failure), and constant success probability p. If yes, use the CED formulas: mean μ = n p and standard deviation σ = sqrt[n p (1 − p)]. Quick example: if n = 20 students and p = 0.3 chance of passing, μ = 20(0.3) = 6 expected passes, and σ = sqrt[20·0.3·0.7] = sqrt[4.2] ≈ 2.05. Always interpret in context: “on average 6 students” and “typical variation ≈ 2.05 students.” On the AP exam you can quote these formulas (they’re on the formula sheet). Also be ready to verify binomial conditions before applying them. For a refresher and more practice, see the Topic 4.11 study guide (https://library.fiveable.me/ap-statistics/unit-4/parameters-for-binomial-distribution/study-guide/0ZX2eo84NRcGsg9O6xMT) and practice problems (https://library.fiveable.me/practice/ap-statistics).
What's the difference between calculating binomial probability and binomial parameters?
Calculating a binomial probability vs. calculating binomial parameters are related but different tasks. - Binomial probability: you compute P(X = k) for a binomial RV X ~ Bin(n, p) using the PMF P(X = k) = C(n,k) p^k (1−p)^(n−k), or a calculator command (binompdf/binomcdf). This answers “what’s the chance we get exactly k successes?” Example: P(X=6) when n=8, p=0.45 uses C(8,6)(0.45)^6(0.55)^2. - Binomial parameters: you identify/compute n and p from the context (check conditions: fixed number of trials, independent, two outcomes, constant p) and then report distribution summaries: mean μ = np and standard deviation σ = sqrt(np(1−p)). Use these when the prompt asks for expected value or variability (UNC-3.C.1). On the AP exam you might be asked either to calculate probabilities or to find/interpret parameters (or both). Review Topic 4.11 for examples and formulas (study guide: https://library.fiveable.me/ap-statistics/unit-4/parameters-for-binomial-distribution/study-guide/0ZX2eo84NRcGsg9O6xMT; unit review: https://library.fiveable.me/ap-statistics/unit-4). For extra practice, try problems at https://library.fiveable.me/practice/ap-statistics.
I don't understand when to use which binomial formula on the AP exam.
Use the binomial PMF when the question asks for an exact probability of k successes with a fixed number of independent Bernoulli trials that all have the same success probability p. Formula: P(X = k) = C(n,k) p^k (1−p)^{n−k}—on the exam you can also use your calculator’s binompdf/binomcdf to avoid messy arithmetic (calculator allowed; formula sheet provided). Use the parameter formulas when they ask for the mean or spread of a binomial: μ = np and σ = sqrt(np(1−p)). Those come from UNC-3.C in the CED and are used for expectations/interpretation (give units, context). Use the normal approximation to the binomial only when n is large enough so np ≥ 10 and n(1−p) ≥ 10 (then apply continuity correction). If those conditions fail, don’t approximate—use the exact binomial. If you want a short refresher and worked examples, check the Topic 4.11 study guide (https://library.fiveable.me/ap-statistics/unit-4/parameters-for-binomial-distribution/study-guide/0ZX2eo84NRcGsg9O6xMT) and practice lots of problems at (https://library.fiveable.me/practice/ap-statistics).
How do I interpret what the mean and standard deviation actually represent in a real situation?
Mean = np: think of this as the long-run average number of successes you'd expect if you repeated the same n Bernoulli trials many times. Example: if n = 20 and p = 0.3, μ = 20(0.3) = 6 means the average number of successes over many repeated samples of 20 will be about 6 (units = “successes”). This is the binomial expected value (UNC-3.C.1). Standard deviation = sqrt(np(1−p)): this measures typical variability around that mean, again in “number of successes.” With n = 20, p = 0.3, σ = sqrt(20·0.3·0.7) ≈ 2.05—so most sample outcomes fall a couple successes away from 6. Use σ when describing spread or when checking normal-approx conditions (often np and n(1−p) ≥ 10 for approximation). Always interpret both with context and units, and ensure binomial conditions (fixed n, independent trials, constant p). For a quick refresher, see the Topic 4.11 study guide (https://library.fiveable.me/ap-statistics/unit-4/parameters-for-binomial-distribution/study-guide/0ZX2eo84NRcGsg9O6xMT)—and practice problems at (https://library.fiveable.me/practice/ap-statistics).
Do I need to memorize both the variance and standard deviation formulas for binomial?
Short answer: memorize the mean μ = np and the standard deviation σ = sqrt(np(1−p)). The CED lists those as the essential parameters (UNC-3.C.1). The variance, Var(X) = np(1−p), is just σ^2, so you don’t need a separate new formula—it follows directly from the SD. Why this matters for AP: the exam gives a formula sheet and tables, but it still expects you to recognize and interpret parameters in context (units, long-run meaning, independence/fixed-n assumptions). So focus on remembering μ = np and σ = sqrt(np(1−p)), know that Var = np(1−p), and practice interpreting them in problems. If you want a quick refresher and practice problems, check the Topic 4.11 study guide (https://library.fiveable.me/ap-statistics/unit-4/parameters-for-binomial-distribution/study-guide/0ZX2eo84NRcGsg9O6xMT) and the Unit 4 overview (https://library.fiveable.me/ap-statistics/unit-4). For extra practice, use the AP Stats practice problem set (https://library.fiveable.me/practice/ap-statistics).
Can you walk me through finding binomial parameters when given n and p?
If you’re given n and p, the binomial model is easy to parameterize and interpret. First check the binomial conditions: fixed number of trials n, each trial is a Bernoulli (success/failure) with the same success probability p, and trials are independent. If those hold, X ~ Binomial(n, p). Two key parameters you should compute and interpret (CED UNC-3.C): - Mean (expected value): μ = np. Interpret in context: “On average, we expect np successes out of n trials.” - Standard deviation: σ = sqrt[np(1 − p)]. Interpret with units (number of successes) and use it to describe typical variability. For probabilities use P(X = k) = C(n, k) p^k (1 − p)^(n−k). For large n you can sometimes use the normal approximation when np ≥ 10 and n(1 − p) ≥ 10 (apply continuity correction). For a quick refresher and AP-style practice problems on this topic, see the Fiveable study guide (https://library.fiveable.me/ap-statistics/unit-4/parameters-for-binomial-distribution/study-guide/0ZX2eo84NRcGsg9O6xMT) and their practice problem pool (https://library.fiveable.me/practice/ap-statistics).