You made it to Unit 2! This part of the AP Stats curriculum focuses on analyzing relationships between two variables. This unit should help you understand how to visualize and describe relationships between two variables using scatterplots, correlation, and least-squares regression.
Here, you'll learn:
- how to create scatterplots and use them to identify patterns and trends in two-variable data
- the concept of correlation and how to calculate the correlation coefficient, which measures the strength and direction of the linear relationship between two variables
- least-squares regression, a method for finding the line of best fit for two-variable data
- how to interpret the slope and intercept of the regression line and how to use the regression equation to make predictions about one variable based on values of the other variable
- evaluating the fit of a linear model
- using residual plots to assess the appropriateness of using a linear model to describe the relationship between two variables
Sounds like a lot, eh? Don't worry! As usual, we'll break this unit into small chunks with examples sprinkled throughout. Are you ready? Here we go!
Exam Weighting
- 5-7% of the test
- Roughly 2 to 3 multiple choice questions
- Possibly one FRQ or a portion of the investigative task

Bivariate Data
After covering single-variable statistics, it’s time to increase the complexity a little bit with two-variable statistics! Just like the differences on univariate data, we also have two different types of bivariate data that we may encounter: categorical and quantitative.
Categorical
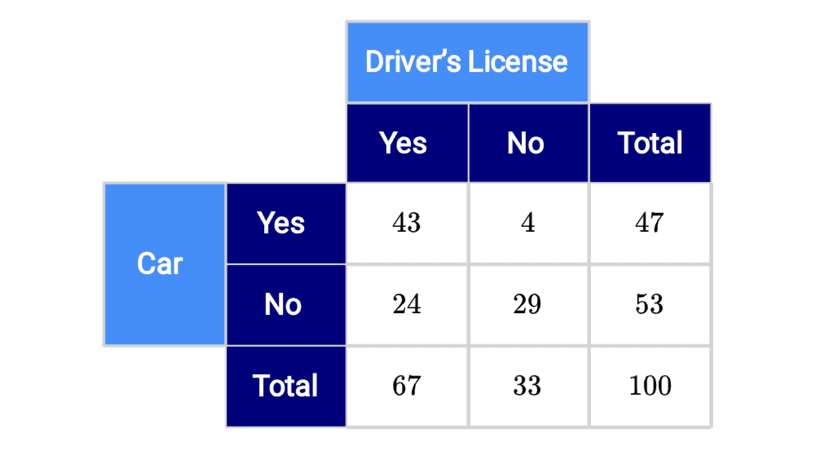
With categorical variables, we can use two way tables to represent the relationship between two different categories of categorical variables. A common example for bivariate categorical data may be something like measuring a student's class level (freshman, sophomore, junior, and senior) along with their learning style preference for 2020-2021 (virtual or traditional). A statistician could take these numbers and see if there was a correlation between class level and learning choice.
Quantitative
With quantitative variables, we can show the relationship between these using scatterplots. We will also see whether there is a relationship between two variables in both situations. This will link to later units as well.
Since every individual has two quantities assigned to them, one of these quantities will be plotted on the x-axis as the independent variable, while the other variable is plotted on the y-axis as the dependent variable. After creating that scatterplot, we can form a trend of our data points using various models, primarily linear regression models in AP Statistics. This means that we will fit a line to our points on the scatterplot so that we can make predictions about other x-values within the range of our model.
For example, we may look at someone's height in inches along the x-axis and their shoe size along the y-axis. In this particular example, one would expect to see a positive correlation, because as height increases, so would shoe size.
Computer Outputs
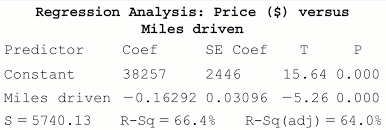
On the AP exam, it is highly unlikely that you will be asked to create a scatterplot, a two way table, or a linear regression model. Instead, the question will generally provide our models via computer outputs or printouts that students are required to be able to interpret. The most important part of this unit is being able to identify the important aspects of a model and interpret what they mean.
Just like in unit 1, being able to interpret your data in context of the problem is the biggest skill you will be tested on. This includes the aspects of categorical models (like two way tables) along with the different aspects of a linear regression model like slope, y-intercept, correlation coefficient, and correlation of determination.
Mathematical Practices
Three of the College Board's mathematical practices for AP Statistics are used in this unit, which will be outlined below.
1. Selecting Statistical Methods
This is useful when we decide whether we want to use two-variable statistics methods and the type to use, or to use inference techniques learned later on. As with the rest of AP Statistics, it is vital that students know whether a problem is employing quantitive data methods or categorical data methods prior to proceeding with any statistical methods.
2. Data Analysis
Using data analysis, we’ll figure out how to figure out different statistics from two-variable data sets and also find ways to model with them and draw conclusions.
3. Statistical Argumentation
In this unit, we will learn to argue about the strength of how much variables are related to each other, and also the most important sentence of this unit: correlation does not imply causation! For instance, if I gather the amount of rain everyday of the week for a year and find that the rain total on Tuesdays is quite a bit higher than Mondays, does this mean that the day of the week causes it to rain more? Obviously not! In this instance, the two variables (day of the week and rain totals) are correlated, but are not causing one another.
Main Ideas for this Unit
- Categorical Variables
- Two Way Tables
- Joint Relative Frequencies
- Marginal Relative Frequencies
- Conditional Relative Frequencies
- Side-by-side bar graphs
- Segmented bar graphs
- Mosaic plots
- Correlation
- Two Way Tables
- Quantitative Variables
- Scatterplots
- Form
- Direction
- Strength
- Unusual features (gaps, clusters, outliers)
- Correlation Coefficient
- Linear Regression (Least Squares Regression)
- Extrapolation
- Residuals
- r, R^2. and s
- Influential Points
- Transforming Data Sets
- Scatterplots
🎥 Watch: AP Stats Unit 2