Additional Relative Frequencies
Let's look back at the two-way table from Unit 2.2.
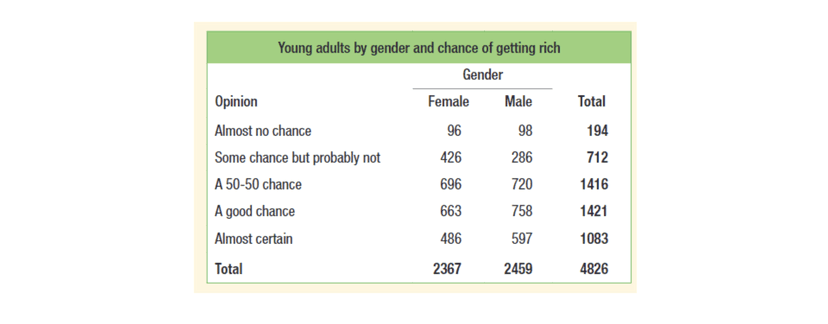

We can find more than just joint relative frequencies here as there’s also marginal relative frequencies and conditional relative frequencies.
Marginal Relative Frequency
A marginal relative frequency is the relative frequency of all the people in a certain category. For example, the marginal relative frequency of a "50-50 chance” is 1416/4826 as from the right margin, we see that 1416 overall respondents gave that response. In other words, the marginal relative frequencies are the row and column totals in a two-way table divided by the total for the entire table.
Conditional Relative Frequency
On the other hand, the conditional relative frequency is the frequency that we have of a particular category given the fact that we know a subject is in another category. The category that we know is called the given, or independent category, while the other is called the dependent category, just like independent and dependent variables on graphs.
For example, the conditional frequency for “50-50 chance given male” is 720/2459 because out of the 2459 males who responded, 720 of them said “50-50 chance.” When calculating a conditional relative frequency, our denominator (or total) is usually considerably smaller than that of overall total.
Determining Associations from a Two-Way Table
From a two-way table, we can use marginal and conditional relative frequencies to consider if two categorical variables are associated or not. To do this, see if two corresponding conditional relative frequencies across different categories are not the same. This is also the same as seeing if the conditional relative frequency is not the same as the marginal relative frequency for the dependent category. This makes it so that certain independent category values are more likely to yield a certain result than others. That is, we can predict behavior given the fact that we know that an individual falls under a certain category.
Example
Using the two-way table above, we can determine that the variables "gender" and "opinion" are independent, or not associated, because the marginal relative frequency of being "50-50 chance" is roughly equal to the conditional relative frequency of being "50-50 chance given male".

🎥Watch: AP Stats - Probability: Two Way Tables, Independence, Tree Diagrams, etc
Vocabulary Practice from 2.1 to 2.3 Material
Match the number with the letter that corresponds to its description!
- Two-way tables
2, Side-by-side bar graphs
-
Mosaic plots
-
Segmented bar graphs
-
Categorical variable
-
Quantitative variable
-
Bivariate variable
-
Marginal relative frequency
-
Conditional relative frequency
A. A graphical display that shows the relationship between two categorical variables by dividing the area of a rectangle into tiles that represent the different categories of both variables.
B. A graphical display that shows the distribution of a categorical variable by displaying the frequency or relative frequency of each category as a bar.
C. A graphical display that shows the relationship between two categorical variables by dividing the bars in a bar graph into segments that represent the different categories of one of the variables.
D. A statistical table that shows the frequencies or relative frequencies of two categorical variables in a cross-tabulated format, with one variable represented by rows and the other by columns.
E. A variable that can take on a limited number of categories or values, such as "male" or "female," but cannot be meaningfully ordered or measured on a continuous scale.
F. A variable that can be measured or ordered on a continuous scale, such as height or weight.
G. The relative frequency of a particular category of a categorical variable within another category, calculated by dividing the frequency or relative frequency of the first category within the second category by the total frequency or relative frequency of the second category.
H. The frequency or relative frequency of a particular category of a categorical variable, calculated by dividing the frequency or relative frequency of that category by the total frequency or relative frequency for the entire sample or population.
I. A statistical concept that refers to the relationship between two variables, often used to describe the association between two categorical variables.
Answers
-
D
-
B
-
A
-
C
-
E
-
F
-
I
-
H
-
G
Vocabulary
The following words are mentioned explicitly in the College Board Course and Exam Description for this topic.
| Term | Definition |
|---|---|
| association | The relationship between two variables where knowing the value of one variable provides information about the other variable. |
| categorical variable | A variable that takes on values that are category names or group labels rather than numerical values. |
| conditional relative frequency | A relative frequency for a specific part of a contingency table, such as cell frequencies in a row divided by the total for that row. |
| distribution | The pattern of how data values are spread or arranged across a range. |
| marginal relative frequencies | The row and column totals in a two-way table divided by the total for the entire table, representing the proportion of observations in each row or column. |
| summary statistics | Numerical measures that describe key features of a dataset, such as center, spread, and shape. |
| two-way table | A table that displays the frequency distribution of two categorical variables, organized in rows and columns. |
Frequently Asked Questions
How do I calculate marginal relative frequency in a two-way table?
Marginal relative frequency = a row total or column total divided by the grand total. In a two-way (contingency) table you first compute row totals and column totals (these are the marginal counts), then divide whichever margin you want by the table’s overall total to get the relative frequency (a proportion or percent). Example: if the table’s grand total = 200 and the “Male” column total = 90, the marginal relative frequency for Male = 90/200 = 0.45 (45%). If the “Yes” row total = 50, marginal relative frequency for Yes = 50/200 = 0.25 (25%). This is exactly UNC-1.Q.1 in the CED. Marginal relative frequencies are different from conditional relative frequencies (cells divided by a row or column total). For more review, see the Topic 2.3 study guide (https://library.fiveable.me/ap-statistics/unit-2/statistics-for-two-categorical-variables/study-guide/0SjltJrb2O0gXsmucKt1) and Unit 2 overview (https://library.fiveable.me/ap-statistics/unit-2). Practice problems are at (https://library.fiveable.me/practice/ap-statistics).
What's the difference between marginal and conditional relative frequency?
Marginal relative frequency is the proportion for a whole row or column in a two-way (contingency) table—you get it by dividing a row total or column total by the grand total (CED: UNC-1.Q.1). It tells you the overall distribution of one variable ignoring the other. A conditional relative frequency is the proportion within a specific subgroup (a cell divided by its row total or column total—CED: UNC-1.Q.2). It tells you the distribution of one variable given a particular value of the other variable (i.e., P(A | B)). Example: If 30 of 100 students are juniors (column total = 30), marginal = 30/100 = 0.30. If 12 of those 30 juniors play soccer, the conditional relative frequency of playing soccer given “junior” = 12/30 = 0.40. Use conditional percentages (segmented bar charts/mosaic plots) to assess association between categorical variables on the exam (Unit 2; see study guide: https://library.fiveable.me/ap-statistics/unit-2/statistics-for-two-categorical-variables/study-guide/0SjltJrb2O0gXsmucKt1). For more practice, check the unit overview (https://library.fiveable.me/ap-statistics/unit-2) and thousands of practice problems (https://library.fiveable.me/practice/ap-statistics).
When do I use conditional relative frequency vs marginal relative frequency?
Use marginal relative frequencies when you want the overall breakdown (row or column totals divided by the grand total). Marginals tell you the overall proportion in a category (e.g., 30% of all students are juniors). This is UNC-1.Q.1 in the CED. Use conditional relative frequencies when you want proportions inside a specific slice of the table—that’s the one you usually use to compare groups or test for association. A conditional frequency divides cell counts by a row total (or column total) to ask “given this row/column, what percent fall into each column/row?” (e.g., of juniors, 55% work in Dept A). This is UNC-1.Q.2 and is what you use to compare distributions and decide if variables are associated (UNC-1.R.1). Conditional rel. freqs are what you plot with segmented bar charts or use to interpret a chi-square test of independence. For a quick refresher, see the Topic 2.3 study guide (Fiveable) here: (https://library.fiveable.me/ap-statistics/unit-2/statistics-for-two-categorical-variables/study-guide/0SjltJrb2O0gXsmucKt1). For extra practice, try problems at (https://library.fiveable.me/practice/ap-statistics).
Can someone explain how to find conditional relative frequency step by step?
Conditional relative frequency tells you the percent (or proportion) of cases in a specific part of a contingency (two-way) table—for example, “given this row, what fraction fall in each column?” Step-by-step: 1. Identify which condition you’re conditioning on (a row or a column). Say you condition on Row A (e.g., “students who own a car”). 2. Find the row total for that condition (sum of all cells in Row A). 3. Take the cell frequency you care about (e.g., cells in Row A & Column 1 = “own a car and drive to school”). 4. Divide the cell frequency by the row total: conditional relative frequency = cell / row total. 5. Convert to percent by ×100 if needed. Example: Row A totals 50 people; the cell for Column 1 is 15. Conditional relative frequency = 15/50 = 0.30 → 30% of people in Row A are in Column 1. Use conditional relative frequencies to compare distributions and check for association (UNC-1.Q.2 and UNC-1.R.1 in the CED). For more examples and practice, see the Topic 2.3 study guide (https://library.fiveable.me/ap-statistics/unit-2/statistics-for-two-categorical-variables/study-guide/0SjltJrb2O0gXsmucKt1) and try practice problems (https://library.fiveable.me/practice/ap-statistics).
I'm confused about two-way tables - how do I know which numbers to divide?
Think about what question you’re asking: “out of the whole table?” or “given this row/column?” That tells you which number to divide. - Marginal relative frequency (UNC-1.Q.1): divide a row total or column total by the grand total. That gives the proportion of the entire table in that row/column. - Joint (cell) frequency: the raw count in one cell. If you want the joint relative frequency, divide that cell by the grand total. - Conditional relative frequency (UNC-1.Q.2): decide which variable you’re conditioning on. If you ask “given row X,” divide each cell in row X by that row’s total. If you ask “given column Y,” divide each cell in column Y by that column’s total. Quick rule: divide by the total that matches what you’re conditioning on. For AP practice and reminders on wording/graphs (segmented bar charts, mosaic plots, chi-square), see the Topic 2.3 study guide (https://library.fiveable.me/ap-statistics/unit-2/statistics-for-two-categorical-variables/study-guide/0SjltJrb2O0gXsmucKt1) and try problems at (https://library.fiveable.me/practice/ap-statistics).
What's the formula for calculating conditional relative frequency?
A conditional relative frequency is the proportion of cases in a specific part of a contingency table given a condition. In probability form: P(A | B) = P(A ∩ B) / P(B). In frequency/table form (CED UNC-1.Q.2): if a cell has count n_{ij} and the row total is R_i (or column total C_j), then Conditional relative frequency of column j given row i = n_{ij} / R_i, (or of row i given column j = n_{ij} / C_j). Example: if 12 people are in the cell (row A, column X) and the row A total is 30, the conditional relative frequency of X given A = 12/30 = 0.40. This is exactly what the AP CED expects you to calculate for two categorical variables (use relative-frequency tables, segmented bar charts, etc.). For a quick topic review see the Fiveable study guide (https://library.fiveable.me/ap-statistics/unit-2/statistics-for-two-categorical-variables/study-guide/0SjltJrb2O0gXsmucKt1) and try practice problems at (https://library.fiveable.me/practice/ap-statistics).
How do I determine if two categorical variables are associated?
Check conditional relative frequencies in a two-way (contingency) table first. If the distribution of one variable changes across rows/columns (i.e., the conditional relative frequencies differ), that’s evidence of association; if they stay the same, the variables look independent. Use a segmented bar chart or mosaic plot to visualize differences in shape/center/variation. For a formal AP-style test, run a chi-square test of independence: - H0: the variables are independent (no association). Ha: they are associated. - Compute expected counts = (row total × column total)/grand total, then χ² = Σ(Observed − Expected)²/Expected. - Check conditions: random sample, independence of observations, and all expected counts ≳ 5 (AP requirement for chi-square). - Compare p-value to α to decide. If significant, report context (which categories differ) and consider a measure of strength (odds ratio for 2×2, or Cramér’s V for larger tables). For a quick review, see the Topic 2.3 study guide (https://library.fiveable.me/ap-statistics/unit-2/statistics-for-two-categorical-variables/study-guide/0SjltJrb2O0gXsmucKt1) and practice problems (https://library.fiveable.me/practice/ap-statistics).
I don't understand when to divide by row total vs column total vs grand total.
Think of what you’re “conditioning on”—that tells you which total to divide by. - Marginal relative frequency: divide row or column totals by the grand total (the whole table) to get overall proportions for one variable (CED: UNC-1.Q.1). - Joint relative frequency (cell proportion): divide a cell count by the grand total to get that cell’s share of all observations. - Conditional relative frequency: divide the cell count by the total of the row or column you’re conditioning on (CED: UNC-1.Q.2). If you want “given row = A,” divide by that row total. If you want “given column = B,” divide by that column total. Quick example: table cell = 12, row total = 40, column total = 50, grand total = 200. - Joint = 12/200 = 0.06 - Conditional given row = 12/40 = 0.30 - Conditional given column = 12/50 = 0.24 On the AP exam you’ll use conditional relative frequencies to compare distributions and judge association (UNC-1.R). For practice, check the Topic 2.3 study guide (https://library.fiveable.me/ap-statistics/unit-2/statistics-for-two-categorical-variables/study-guide/0SjltJrb2O0gXsmucKt1) and try problems at (https://library.fiveable.me/practice/ap-statistics).
How do I compare distributions for two categorical variables?
Compare the distributions by using a contingency (two-way) table and conditional relative frequencies. First get marginal totals (row/column totals ÷ grand total) and then compute conditional percents for the group you care about (cells in a row ÷ that row total or cells in a column ÷ that column total). Use those conditional percents to answer “which group has a higher proportion of …?”—that’s how you compare distributions (UNC-1.Q, UNC-1.R). Graphically show differences with segmented bar charts or mosaic plots so the conditional percents are easy to read. If you want to test whether the variables are associated (not independent), run a chi-square test of independence: check expected counts (usually ≥5) and compare the p-value to α (reject H0 if p < α). Also be aware of Simpson’s paradox—a lurking variable can flip conclusions. For effect size use odds ratios or Cramér’s V. For step-by-step examples and AP-style practice, see the Topic 2.3 study guide (https://library.fiveable.me/ap-statistics/unit-2/statistics-for-two-categorical-variables/study-guide/0SjltJrb2O0gXsmucKt1) and try problems at (https://library.fiveable.me/practice/ap-statistics). Fiveable’s study guide and practice sets follow the CED terminology and exam style.
What does it mean when variables are associated in a contingency table?
When two categorical variables are associated in a contingency (two-way) table, knowing the category of one variable changes the distribution of the other. Practically, this means some conditional relative frequencies (cell counts divided by a row or column total) differ from the marginal relative frequencies (row/column totals divided by the grand total). If conditional distributions equal the marginals, the variables are independent; if not, they’re associated. On the AP exam you’ll compare distributions using conditional relative frequencies, segmented bar charts or mosaic plots and—when doing inference—use a chi-square test of independence (check expected counts) to decide if the observed association is unlikely by chance (see CED Topic 2.3 keywords: conditional relative frequency, marginal relative frequency, chi-square, expected count, independence vs association). For a quick review, check the Topic 2.3 study guide (https://library.fiveable.me/ap-statistics/unit-2/statistics-for-two-categorical-variables/study-guide/0SjltJrb2O0gXsmucKt1) and practice problems (https://library.fiveable.me/practice/ap-statistics).
How do I solve problems with two-way tables on the AP exam?
Start by labeling your table: list cell (joint) counts, row totals, column totals, and grand total. Then: 1. Compute marginal relative frequencies (row/column totals ÷ grand total) to describe overall distribution. 2. Compute conditional relative frequencies for the question asked (e.g., P(response | group) = cell ÷ that row or column total). Always check which variable is the condition. 3. Compare distributions using those conditional percents (this answers UNC-1.R: look for association vs. independence). Say which group has the higher percent and give context. 4. For inference questions, compute expected counts = (row total × column total)/grand total and check chi-square conditions (all expected ≥ 5) before doing χ² = Σ((obs−exp)²/exp). Compare to critical χ² or use p-value to conclude association vs. independence. 5. Watch for Simpson’s paradox (stratify if needed). Practice these steps on sample two-way tables—see the Topic 2.3 study guide (https://library.fiveable.me/ap-statistics/unit-2/statistics-for-two-categorical-variables/study-guide/0SjltJrb2O0gXsmucKt1), the Unit 2 overview (https://library.fiveable.me/ap-statistics/unit-2), and plenty of practice problems (https://library.fiveable.me/practice/ap-statistics).
Why do I keep getting different answers when calculating relative frequencies?
You're probably changing the denominator. In a two-way (contingency) table there are three common relative frequencies: - Joint (cell) relative frequency: cell count divided by the grand total. Example: 12 people out of 60 → 12/60 = 0.20. - Marginal relative frequency: a row or column total divided by the grand total (UNC-1.Q.1). - Conditional relative frequency: a cell count divided by its row total (or column total)—i.e., “given” a row or column (UNC-1.Q.2). Example: if that cell’s row total is 20, the conditional frequency = 12/20 = 0.60. If you mix these up you’ll get different answers. Also watch rounding, whether you condition on rows vs columns, and whether software/table labeling uses row- or column-conditionals. For comparing distributions or checking association, use conditional relative frequencies and visualize with segmented bar charts or mosaic plots (Topic 2.3). For a concise refresher, see the Topic 2.3 study guide (https://library.fiveable.me/ap-statistics/unit-2/statistics-for-two-categorical-variables/study-guide/0SjltJrb2O0gXsmucKt1) and try practice problems (https://library.fiveable.me/practice/ap-statistics).
When looking at a two-way table, how do I know if I should find marginal or conditional frequencies?
Use marginal when you want the overall distribution; use conditional when you want the distribution for a specific subgroup. - Marginal relative frequencies = row or column totals divided by the grand total. Use these to describe overall rates (e.g., “30% of all students prefer A”). - Conditional relative frequencies = cell count divided by its row total (or column total). Use these when you compare groups or check association (e.g., “Among juniors, 40% prefer A” or “Given grade level, what percent choose A?”). Quick rule: if the question asks “overall,” or “what proportion of the whole…,” use marginals. If it asks “among X” or “given X,” or you’re comparing distributions between categories (checking independence/association, making segmented bar charts or mosaic plots), compute conditionals. The AP CED calls out both (UNC-1.Q.1 & UNC-1.Q.2); for practice and examples see the Topic 2.3 study guide (https://library.fiveable.me/ap-statistics/unit-2/statistics-for-two-categorical-variables/study-guide/0SjltJrb2O0gXsmucKt1) and do problems at (https://library.fiveable.me/practice/ap-statistics).
What's the difference between a contingency table and a two-way table?
They’re basically the same thing in AP Stats—both organize counts for two categorical variables in rows and columns. “Two-way table” is the neutral name for the arrangement; “contingency table” emphasizes that you’re looking at how the two variables might be related (association vs. independence). What to look for on the exam: cells show joint (cell) frequencies, row/column totals give marginal frequencies (and marginal relative frequencies = totals ÷ grand total, UNC-1.Q.1), and you’ll often compute conditional relative frequencies (cell ÷ row or column total) to compare distributions (UNC-1.Q.2). Contingency/two-way tables are the basis for segmented bar charts, mosaic plots, and the χ² test of independence (expected counts, independence vs association). For a quick AP-focused review, see the Topic 2.3 study guide (https://library.fiveable.me/ap-statistics/unit-2/statistics-for-two-categorical-variables/study-guide/0SjltJrb2O0gXsmucKt1). For more practice, check Unit 2 (https://library.fiveable.me/ap-statistics/unit-2) and the AP Stats practice problems (https://library.fiveable.me/practice/ap-statistics).
How do I use summary statistics to compare categorical variable distributions?
Use a contingency (two-way) table and focus on relative frequencies. First compute marginal relative frequencies (row & column totals divided by the grand total) to describe overall makeup (UNC-1.Q.1). To compare groups, compute conditional relative frequencies for the appropriate rows or columns (cell ÷ row total or cell ÷ column total)—those are the distributions you actually compare (UNC-1.Q.2). Display them with segmented bar charts or a mosaic plot so you can see differences in proportions. For inference, the chi-square test of independence compares observed vs expected counts (check expected count conditions) to decide if the variables are associated; report test statistic, p-value, and whether p < α (AP exam expects correct conditions and interpretation). Watch for Simpson’s paradox: aggregated marginals can hide or reverse associations. For quick practice and examples, see the Topic 2.3 study guide (https://library.fiveable.me/ap-statistics/unit-2/statistics-for-two-categorical-variables/study-guide/0SjltJrb2O0gXsmucKt1) and Unit 2 overview (https://library.fiveable.me/ap-statistics/unit-2). More practice problems: (https://library.fiveable.me/practice/ap-statistics).