📈AP Pre-Calculus Unit 2 Review
2.14 Logarithmic Function Context and Data Modeling
2.14 Logarithmic Function Context and Data Modeling
Unit & Topic Study Guides
Unit 1 – Polynomial and Rational Functions
Unit 2 – Exponential and Logarithmic Functions
Unit 3 – Trigonometric and Polar Functions
Unit 4 – Functions Involving Parameters, Vectors, and Matrices
AP Precalculus Exam
Mathematical Practices
TLDR
Logarithmic functions model situations with proportional growth or repeated multiplication, where input values change proportionally while output values change in equal-length steps. In AP Precalculus, you build a logarithmic model from two input-output pairs, from a proportion and a real zero, or by using logarithmic regression with technology, then use that model to predict values for the dependent variable.

Why This Matters for the AP Precalculus Exam
Topic 2.14 connects logarithmic functions to real data and real contexts, which is exactly the kind of modeling thinking the AP Precalculus exam rewards. Because logarithmic functions are the inverses of exponential functions, this topic asks you to flip your perspective: instead of output values changing proportionally, the input values change proportionally over equal-length output-value intervals. Logarithmic models can predict dependent-variable values and can also be used to determine independent-variable values when the context allows it.
On the exam, you may need to:
- Recognize when a logarithmic model fits a context or data set.
- Build a model in the form using given information.
- Use logarithmic regression on a calculator and interpret the result.
- Predict values for the dependent variable and explain what your answer means in context.
Some questions allow a graphing calculator, so being fluent with entering data, running a logarithmic regression, and reading the output is worth practicing before test day. Showing clear steps is important for clear exam work, especially since small errors slip in easily when you manipulate logarithms.
Key Takeaways
- Logarithmic functions model proportional growth or repeated multiplication, with input values changing proportionally over equal-length output-value intervals.
- A logarithmic model can be built from a proportion and a real zero, or from two input-output pairs.
- You construct models by applying transformations to the general form based on the context or data.
- Technology lets you build a model from data using logarithmic regression.
- The natural logarithm is often useful for modeling real-world phenomena.
- Once you have a model, you can predict values for the dependent variable.
Understanding Logarithmic Models
A logarithmic function tells you the exponent: is the power you raise the base to in order to get . Because logarithmic functions are inverses of exponential functions, they fit situations where the output grows by equal amounts while the input is multiplied by a constant factor.
In other words, exponential growth has output values changing multiplicatively as input changes additively. Logarithmic growth flips this: output values change additively as input values change multiplicatively. That is why logarithmic models show up for things like sound level, earthquake magnitude, and acidity, where the underlying quantities span a huge range but the scale moves in steady steps.
If the output value happens to be a whole number, it tells you how many times the initial value has been multiplied by the proportion.
Sample Application: The Sound of Music
The decibel scale is a real-world application of a logarithmic model, not required AP content, but it shows how these functions work.
Sound level is often measured in decibels (dB), which are logarithmically related to the intensity of a sound. The intensity of a sound is measured in watts per square meter (), and the relationship between intensity and decibels is given by the equation:
where L is the sound level in decibels, I is the intensity of the sound, and is a reference intensity, typically taken to be the threshold of human hearing, which is approximately .
Suppose we want to model the sound level of a rock concert in a large stadium. We measure the sound intensity at various locations and record the following data:
| Location | Intensity () |
|---|---|
| Stage | 1.0 |
| Front row | 0.1 |
| Middle of the crowd | 0.01 |
| Back of the crowd | 0.001 |
To find the sound level in decibels at each location, plug the measured intensity and reference intensity into the equation:
For the stage:
For the front row:
For the middle of the crowd:
For the back of the crowd:
The sound level decreases as we move away from the stage, with a difference of 10 dB between each location. That makes sense, since sound intensity drops as distance from the source increases.
Now we can build a logarithmic function to model this relationship using the form:
where y is the sound level, is the intensity, and and are constants.
From the data we have the points :
Using these points to solve for and :
So the logarithmic function model is:
We can use this function to predict the sound level at any intensity. For example, at :
This model gives us a way to quantify the relationship between sound intensity and sound level in decibels.
Lines and Logarithmic Regression
You can build a logarithmic model from an appropriate proportion and a real zero, or from two input-output pairs. With two points, set up a system using the form (or ) and solve for the constants.
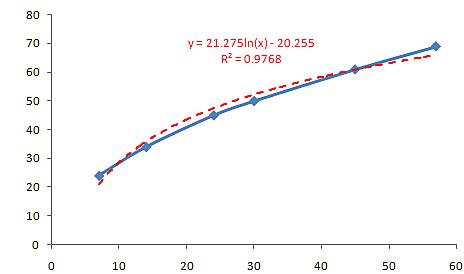
Technology, such as logarithmic regression, can also construct a logarithmic model for a full data set. The natural log function, , is often useful for modeling real-world phenomena like growth and decay.
Once you have a model, you can predict values for the dependent variable based on the context or data set. To check that a model fits well, look at the residuals: a residual plot without a clear pattern supports your choice of model.
How to Use This on the AP Precalculus Exam
Problem Solving
- To build a model from two input-output pairs, plug both points into (or ) and solve the resulting system for the constants.
- Watch the domain. A logarithmic function in general form is only defined for , and its graph has a vertical asymptote at .
- Track whether your model is increasing or decreasing, and whether it is concave up or concave down, since logarithmic functions are always one or the other.
Calculator
- Enter the data, run a logarithmic regression, and read off the constants for form.
- Use the regression equation to predict a dependent value, then state what that prediction means in the context.
- If you are deciding between models, plot the residuals and choose the model whose residual plot has no clear pattern.
Common Trap
- Do not assume every increasing data set is logarithmic. Logarithmic growth rises quickly at first and then levels off, showing diminishing returns, which is different from exponential growth.
- Keep your steps visible. Logarithm rules are easy to misapply, so write each manipulation out instead of skipping ahead.
Common Misconceptions
- Logarithmic and exponential are not the same thing. They are inverses. Exponential output changes multiplicatively as input changes additively; logarithmic output changes additively as input changes multiplicatively.
- A logarithmic model is not defined for all x. The general form requires , so predictions at or below zero do not make sense.
- A high alone does not prove the best model. You still check the residual plot for a pattern before deciding a logarithmic model is appropriate.
- The base matters, but all log functions are related. Because of the change of base property, every logarithmic function is a vertical dilation of every other, so you can convert between bases when needed.
- "Whole number output" has meaning. When the output of a logarithmic model is a whole number, it tells you how many times the initial value has been multiplied by the proportion, not a random count.
Related AP Precalculus Guides
Vocabulary
The following words are mentioned explicitly in the AP® course framework for this topic.Term | Definition |
|---|---|
exponential function | A function of the form f(x) = ab^x where a ≠ 0 is the initial value and b > 0, b ≠ 1 is the base. |
logarithmic function | A function of the form f(x) = a log_b x where b > 0, b ≠ 1, and a ≠ 0, characterized by output values changing additively as input values change multiplicatively. |
logarithmic regression | A statistical method using technology to construct a logarithmic function model that best fits a given data set. |
natural logarithm | The logarithmic function with base e, denoted ln(x), that is particularly useful for modeling real-world phenomena. |
proportional growth | Growth where input values change proportionally over equal-length output-value intervals, often modeled by logarithmic functions. |
real zero | A real number value that makes a polynomial function equal to zero, corresponding to an x-intercept on the graph. |
repeated multiplication | A process where an initial value is multiplied by the same proportion multiple times, which can be modeled using logarithmic functions. |
transformation | Changes applied to a parent function such as translations, reflections, stretches, or compressions. |
Frequently Asked Questions
When should I use a logarithmic model in AP Precalculus?
Use a logarithmic model when input values change proportionally while output values change by equal amounts. Logarithmic models often show fast early change followed by leveling off.
How do logarithmic models relate to exponential models?
Logarithmic functions are inverses of exponential functions. Exponential models have outputs changing multiplicatively over equal input intervals; logarithmic models reverse that relationship.
How do you build a logarithmic function from two points?
Choose a form such as y = a + b ln x or f(x) = a log_b x, substitute both input-output pairs, and solve the resulting system for the constants.
What is logarithmic regression?
Logarithmic regression uses technology to fit a logarithmic function to a data set. After finding the regression equation, use residuals and context to decide whether the model is appropriate.
What is the domain of a logarithmic model?
A basic logarithmic model requires positive inputs, so x must be greater than 0 unless transformations change the input expression. Predictions at invalid input values do not make sense.
How is AP Precalculus 2.14 tested?
AP Precalculus 2.14 often asks you to construct, interpret, or use a logarithmic function model from context, data, two points, a regression, or a transformed log form.