📈AP Pre-Calculus Unit 1 Review
1.14 Function Model Construction and Application
1.14 Function Model Construction and Application
Unit & Topic Study Guides
Unit 1 – Polynomial and Rational Functions
Unit 2 – Exponential and Logarithmic Functions
Unit 3 – Trigonometric and Polar Functions
Unit 4 – Functions Involving Parameters, Vectors, and Matrices
AP Precalculus Exam
Mathematical Practices
Function model construction is about building a model from data or a real situation, then using it to answer questions. In AP Precalculus, you may construct linear, quadratic, cubic, quartic, higher-degree polynomial, piecewise-defined, and rational models, sometimes by transforming a parent function and sometimes by running a regression on a calculator.
Why This Matters for the AP Precalculus Exam
This topic pulls together everything from Unit 1. You already know how to read end behavior, find zeros, spot asymptotes, and transform graphs. Here you turn those skills into a working model and then use it.
Part of the AP Precalculus exam allows a graphing calculator, and this is exactly where regressions show up. You may be asked to fit a linear, quadratic, cubic, or quartic model to data and then use that model to predict a value or a rate of change. On free-response work, you are expected to explain your reasoning and justify conclusions, not just write down an answer, so practice stating why you chose a function type and what your prediction means in context. Clear units and a clear setup make your work easier to follow and score.

Key Takeaways
- Choose the function type from the pattern in the data and the context, not just whatever is fastest to compute.
- You can build a model three main ways: from restrictions and structure, by transforming a parent function, or by running a regression with technology.
- Regressions you should be ready to run include linear, quadratic, cubic, and quartic.
- Piecewise-defined models combine different functions over non-overlapping intervals, each with its own rule.
- Rational functions model inversely proportional relationships, including inverse-square situations like gravitational and electromagnetic force.
- After building a model, use it to predict values, rates of change, average rates of change, and changing rates of change, and always attach correct units.
Linear, Polynomial, and Piecewise-Defined Function Models
A model can be built from the restrictions you identify in a math or real-world scenario. These restrictions include domain and range limits plus any assumptions about the system. Stating them keeps your model honest, so predictions stay valid and relevant.
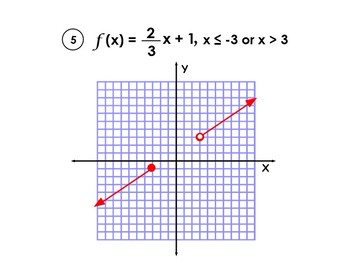
In the example below, the function is defined only where x is less than or equal to -3 or greater than 3. That domain restriction is part of the model.
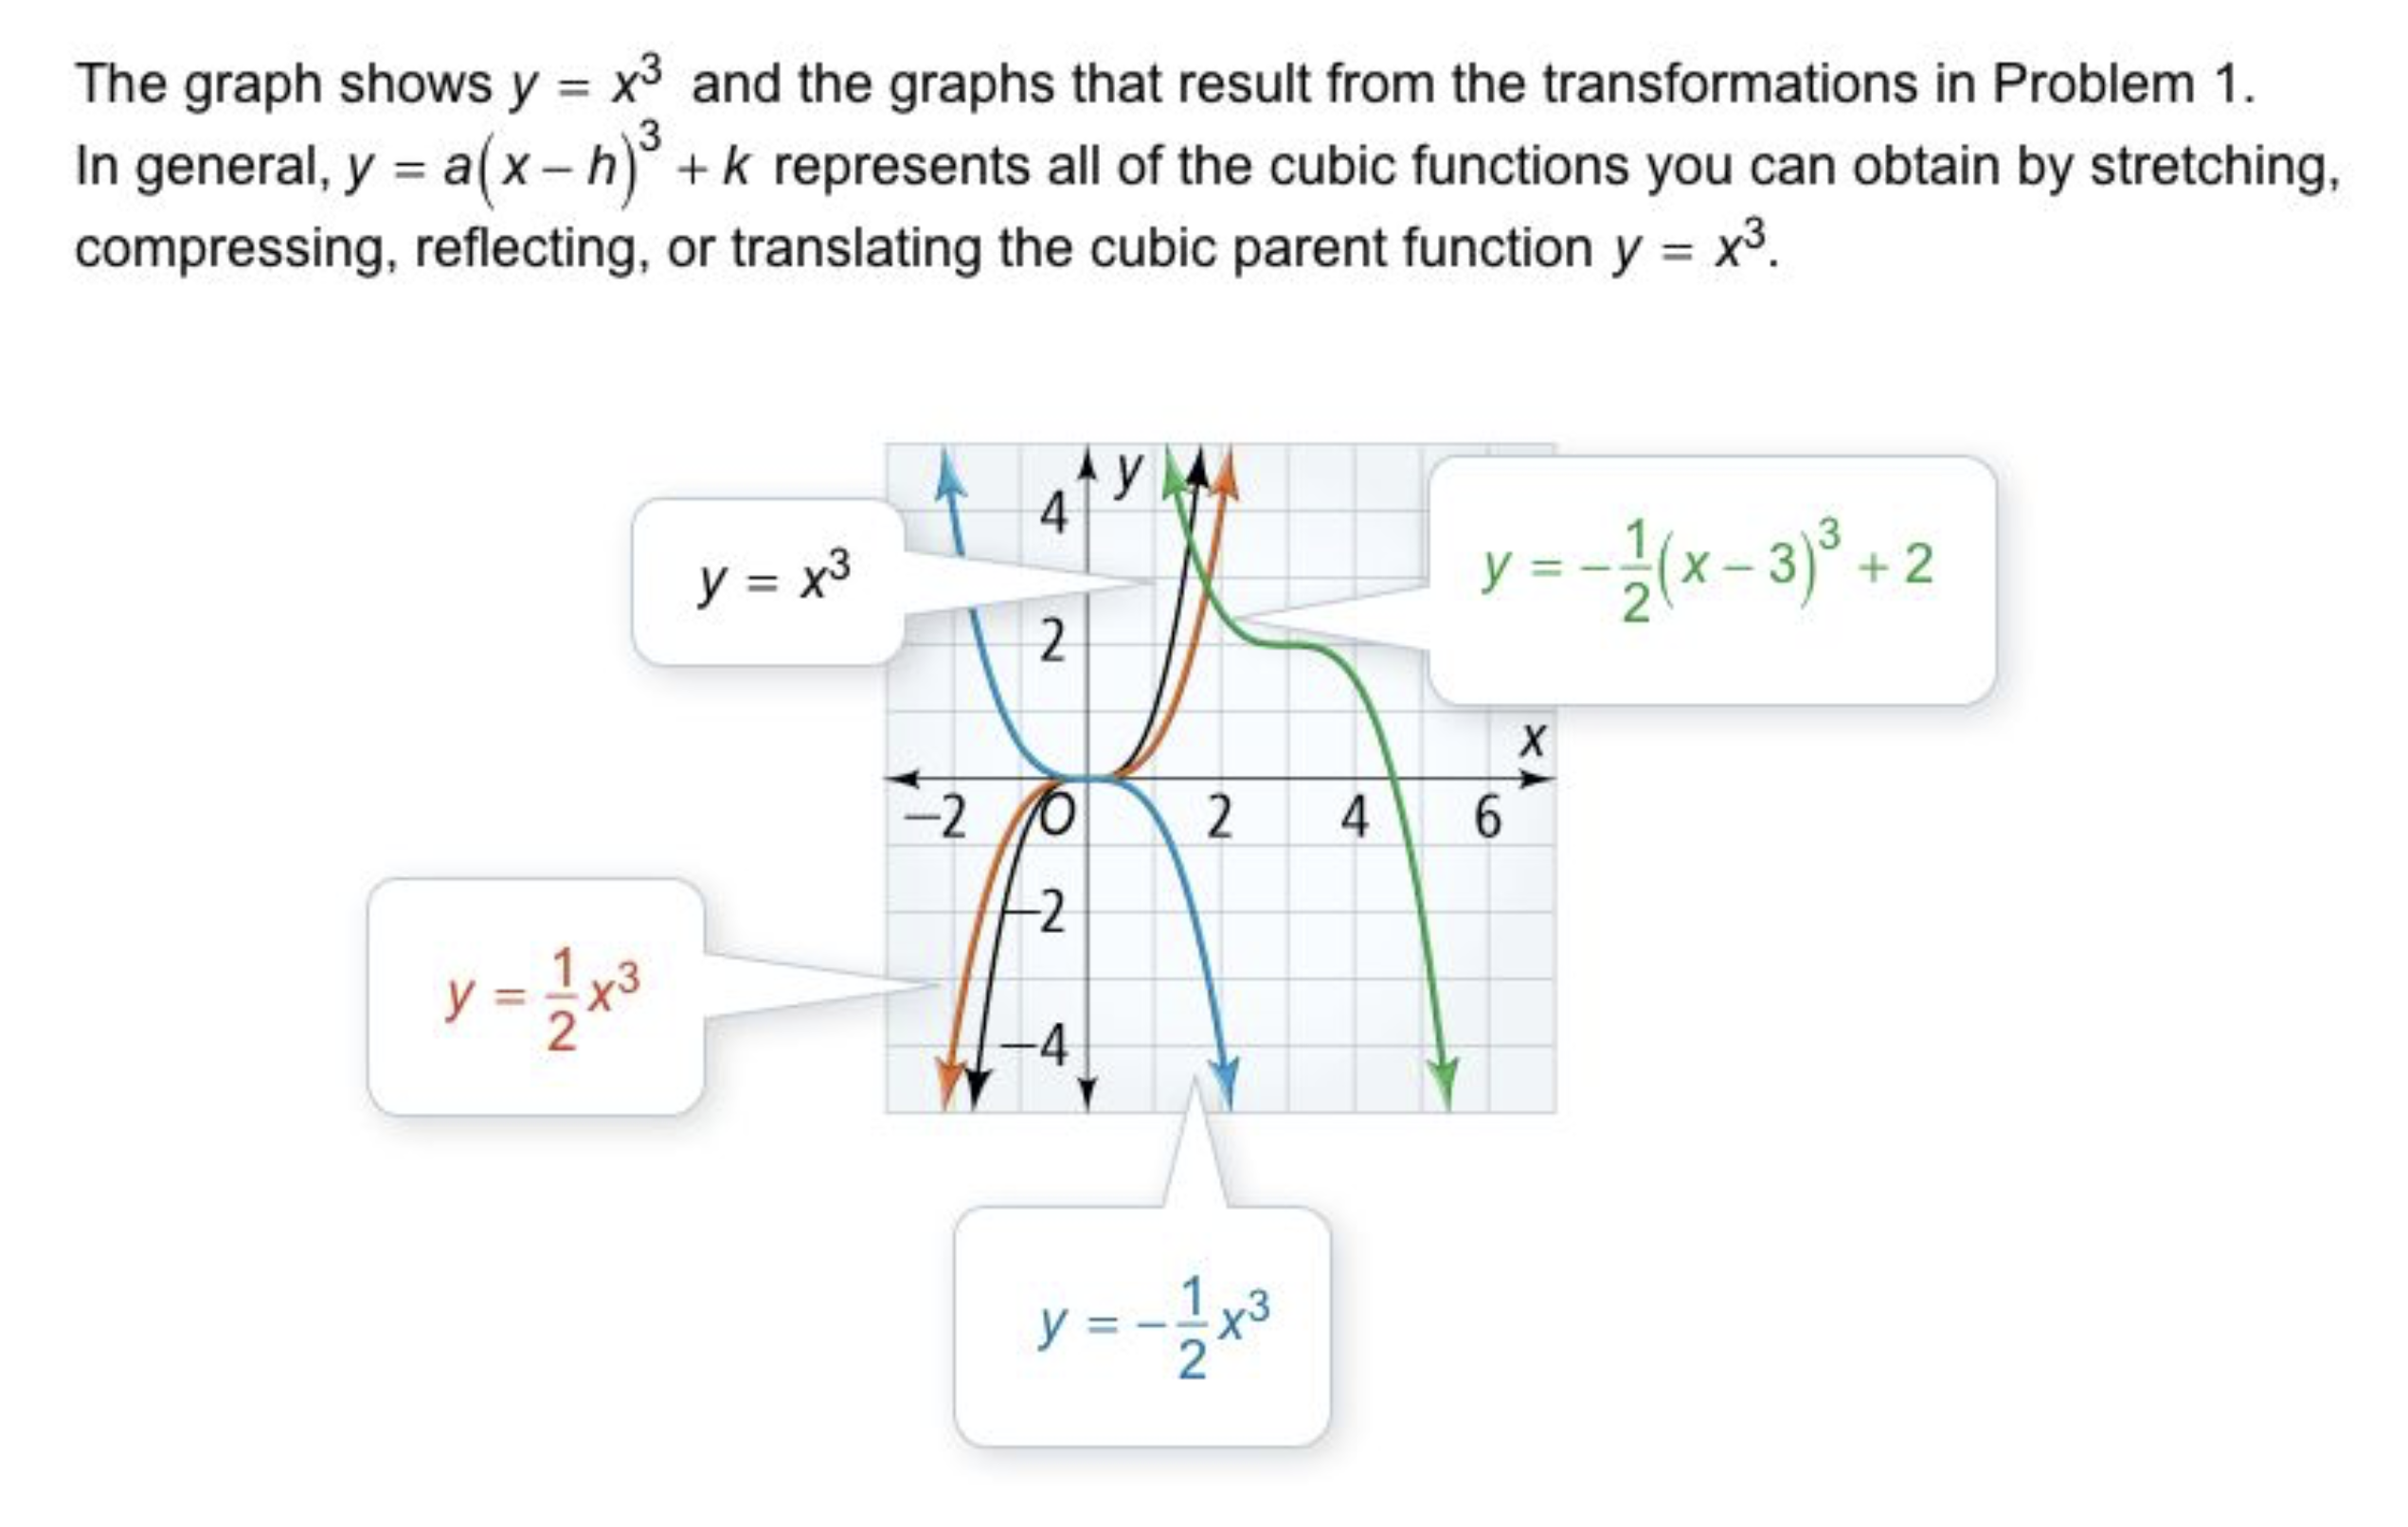
You can also build a model by transforming a parent function. A parent function is a basic function like that you shift, reflect, or stretch to match a data set. The idea is to start simple and adjust.
In the example below, a target curve looks like the green graph, so you might start with (black), then add a constant multiple and shifts (blue and orange) until you land on something close to green.
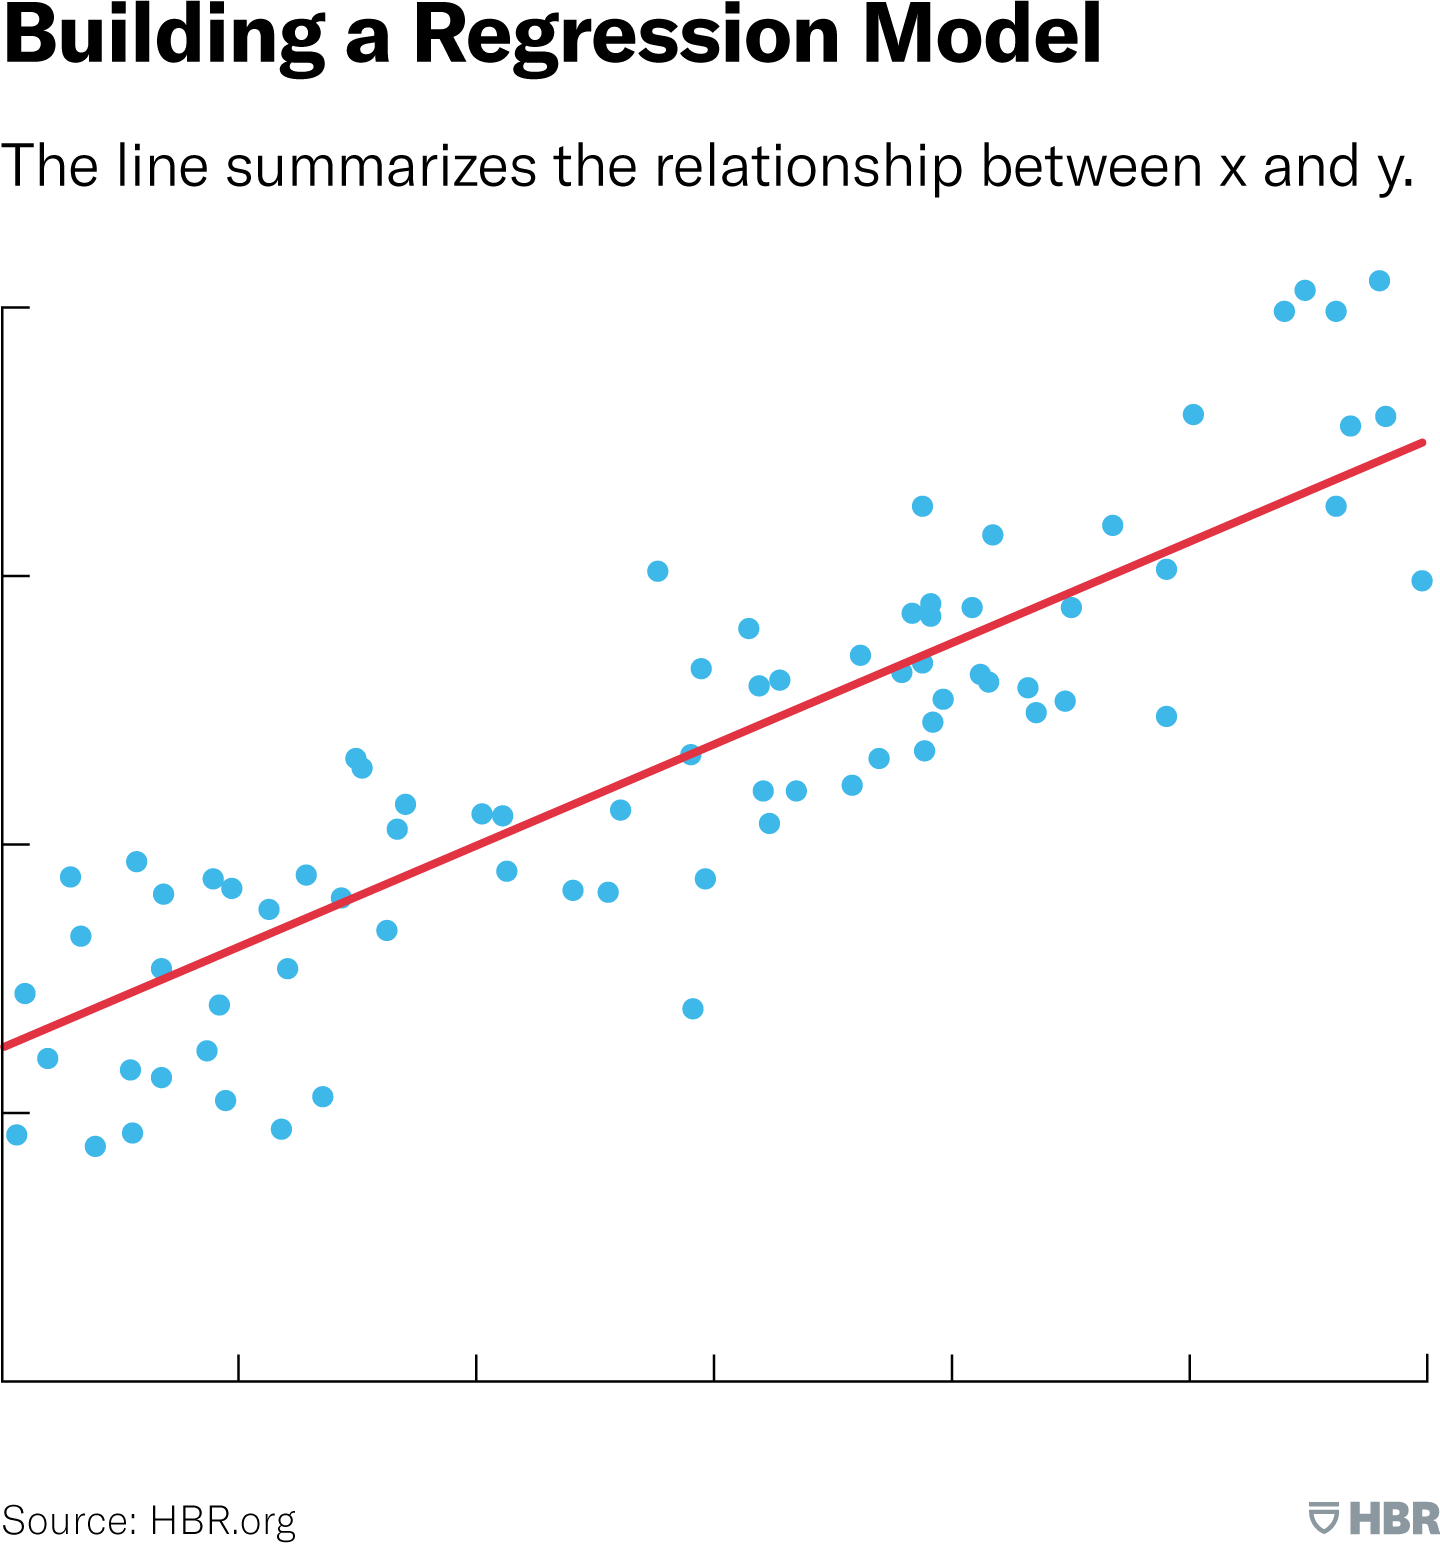
A third option is technology and regression. Regression is a statistical method that fits a function to data, which helps when a data set is large or the underlying pattern is not obvious by hand. On the calculator, you should be comfortable running linear, quadratic, cubic, and quartic regressions.
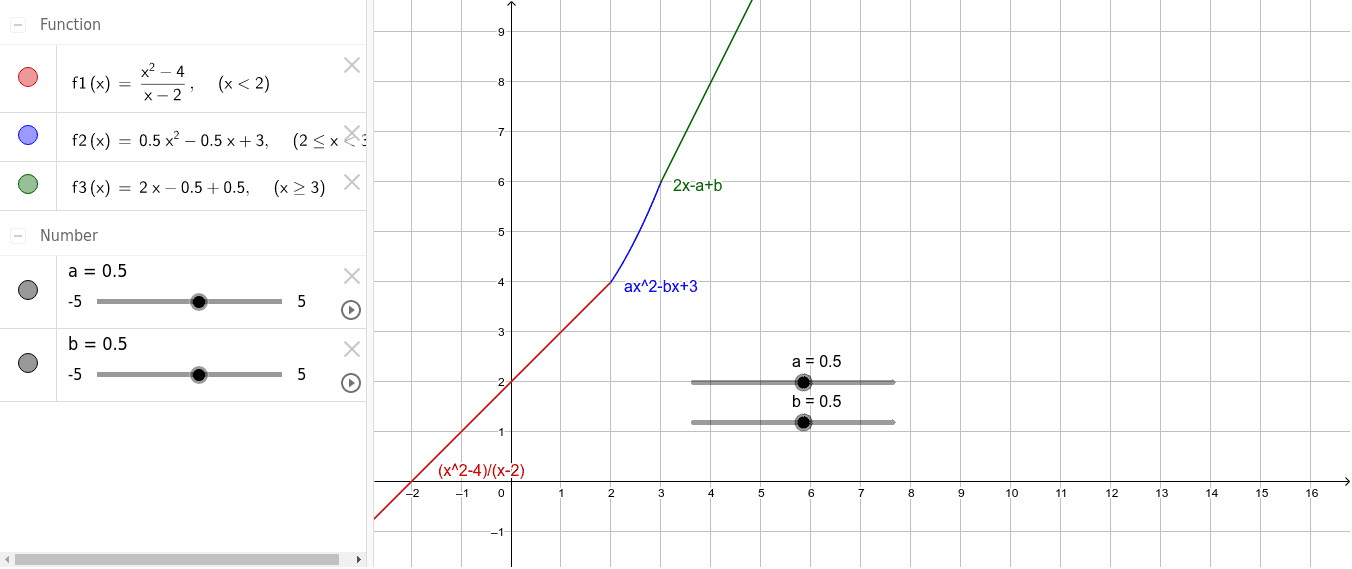
A piecewise-defined model combines several modeling techniques. You can stitch together different polynomial or other functions over non-overlapping intervals, which lets the model capture different behavior in different ranges.
The right technique depends on the data and your goal. Consider more than one approach and check which actually fits, rather than defaulting to whatever is easiest to set up.
Rational Function Models
Data sets and scenarios with inversely proportional quantities can often be modeled by rational functions. A rational function can be written as , where p(x) and q(x) are polynomials.
Inverse-square relationships are a common case. Gravitational force and electromagnetic force between objects are both inversely proportional to the square of the distance.
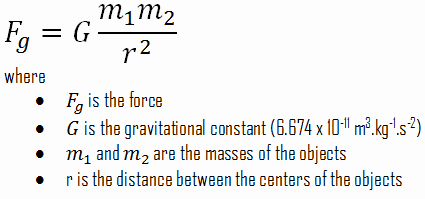
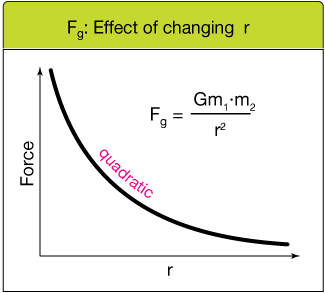
Gravitational force between two objects is , where is the force, is the gravitational constant, and are the masses, and is the distance. Rewriting gives , a rational expression in .
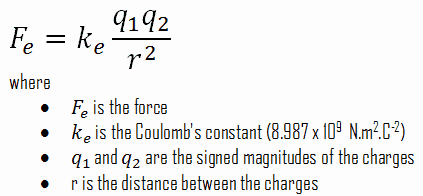
Electromagnetic force between two charges follows Coulomb's law: the force is inversely proportional to the square of the distance. This is , where is the force, is a constant, and are the charges, and is the distance.
In both cases the force drops off with the square of the distance, so a rational model fits well. Many other physical relationships work the same way.
Drawing Conclusions and Adding Units
Once a model is built, use it to answer key questions about the data or scenario: how the variables relate, what patterns appear, and what predictions you can make.
A common use is predicting an output from an input. If a model predicts the price of a product from the number of units sold, you can plug in a number of units and read out a predicted price.
A model also predicts rates of change, average rates of change, and changing rates of change. For instance, you can use it to estimate how fast price changes as units sold increase, or the average rate of change of price over a range of units.
When you interpret results, watch the units of the variables and pull the correct units from the context. If the model outputs price in dollars, report the answer in dollars, not some other unit. Stating units clearly makes your reasoning easier to follow.
How to Use This on the AP Precalculus Exam
Problem Solving
- Read the data or scenario first and decide on a function type before touching the calculator. Roughly constant rate of change points to linear, a single max or min points to quadratic, and multiple turns point to higher-degree polynomials.
- For inversely proportional or inverse-square situations, reach for a rational model.
- When you run a regression, enter the data carefully and record the model with enough decimal places to stay accurate in later steps.
Free Response
- Justify your model choice in words. Connect the pattern in the data or the context to the function type you picked.
- After predicting a value or rate of change, state what the number means in context and include units.
- If the scenario forces a domain or range restriction, write it down and explain why.
Common Trap
- Do not extrapolate far past your data and treat the answer as certain. A regression model fits the given data but can fail well outside that range.
Common Misconceptions
- A high-degree polynomial is not automatically a better model. A quartic can fit sample points closely but behave badly between or beyond them. Match the degree to the actual pattern.
- Regression does not prove cause. It describes a relationship in the data; it does not show that one variable causes the other.
- Inverse proportionality is not the same as a negative linear relationship. Inversely proportional means output scales with 1 over the input (or 1 over the input squared), which is a rational model, not a straight line with negative slope.
- Units are not an afterthought. A prediction without correct units is incomplete, and the rate of change carries its own units, such as dollars per unit.
- Piecewise models still need each piece defined on its own interval with no overlap, and you should check that the right rule is used at each input.
Related AP Precalculus Guides
Vocabulary
The following words are mentioned explicitly in the AP® course framework for this topic.Term | Definition |
|---|---|
average rate of change | The change in the output of a function divided by the change in the input over a specified interval, calculated as (f(b) - f(a))/(b - a) for the interval [a, b]. |
changing rates of change | The variation in how quickly a quantity changes over different intervals, indicating acceleration or deceleration in the rate of change. |
contextual scenario | A real-world situation or problem context in which a mathematical model is applied. |
cubic function | A polynomial function of degree 3 with the form f(x) = ax³ + bx² + cx + d. |
cubic regression | A regression technique that fits a cubic function to a data set. |
electromagnetic force | The force between charged objects or magnetic poles, which is inversely proportional to the square of the distance between them. |
function model | A mathematical function used to represent and analyze relationships in a data set or real-world scenario. |
gravitational force | The attractive force between two objects due to their masses, which is inversely proportional to the square of the distance between them. |
inversely proportional | A relationship between two quantities where one quantity increases as the other decreases by a constant factor, typically expressed as y = k/x. |
linear function | A polynomial function of degree 1 with the form f(x) = mx + b, representing a constant rate of change. |
linear regression | A regression technique that fits a linear function to a data set. |
parent function | The simplest form of a family of functions, used as a base for creating transformed functions. |
piecewise-defined function | A function defined by different expressions over different intervals of its domain. |
polynomial function | A function that can be expressed in the form p(x) = a_n x^n + a_{n-1} x^{n-1} + ... + a_1 x + a_0, where n is a positive integer and a_n is nonzero. |
quadratic function | A polynomial function of degree 2 with the form f(x) = ax² + bx + c, creating a parabolic graph. |
quadratic regression | A regression technique that fits a quadratic function to a data set. |
quartic function | A polynomial function of degree 4 with the form f(x) = ax⁴ + bx³ + cx² + dx + e. |
quartic regression | A regression technique that fits a quartic (fourth-degree polynomial) function to a data set. |
rate of change | The measure of how quickly a function's output changes relative to changes in its input. |
rational function | A function expressed as the ratio of two polynomials, where the denominator is not equal to zero. |
regression | A statistical method for fitting a function to a data set to model the relationship between variables. |
regression analysis | A statistical method used to fit a function to a set of data points to model the relationship between variables. |
restrictions | Limitations placed on the domain or range of a function model based on mathematical, contextual, or data-based considerations. |
transformation | Changes applied to a parent function such as translations, reflections, stretches, or compressions. |
Frequently Asked Questions
What is function model construction in AP Precalculus?
Function model construction means choosing and building a function that represents a data set or contextual scenario, then using that model to answer questions.
How do you choose a function model?
Choose the model type from the pattern in the data and the context. Linear, quadratic, cubic, quartic, piecewise, and rational models each fit different kinds of behavior.
When should I use regression in AP Precalculus?
Use regression when you have data and need technology to fit a linear, quadratic, cubic, or quartic model. Then check whether the model makes sense in context.
When does a rational function model make sense?
A rational model often fits contexts involving inverse proportionality, including inverse-square relationships like gravitational or electromagnetic force depending on distance.
What is a piecewise-defined function model?
A piecewise-defined model combines different rules on different intervals. It is useful when one function cannot describe the whole scenario accurately.
What should I include when applying a function model?
State the prediction or rate of change in context, include correct units, and note any domain restrictions or limits on how far the model should be used.