📈AP Pre-Calculus Unit 1 Review
1.3 Rates of Change in Linear and Quadratic Functions
1.3 Rates of Change in Linear and Quadratic Functions
Unit & Topic Study Guides
Unit 1 – Polynomial and Rational Functions
Unit 2 – Exponential and Logarithmic Functions
Unit 3 – Trigonometric and Polar Functions
Unit 4 – Functions Involving Parameters, Vectors, and Matrices
AP Precalculus Exam
Mathematical Practices
The average rate of change of a function over an interval is the slope of the secant line connecting the two endpoints. For a linear function this rate is always constant, and for a quadratic function the average rates of change over equal-length intervals follow a linear pattern, which means those rates themselves change at a constant rate.
Why This Matters for the AP Precalculus Exam
This topic builds the rate-of-change thinking you use across all of AP Precalculus. You will calculate average rates of change from equations, tables, and graphs, then interpret what those values say about a function's behavior. Recognizing that linear functions have constant average rates while quadratic functions have linearly changing average rates helps you tell function types apart and connect rates to concavity. On both the multiple-choice and free-response sections, you may need to compute an average rate, read it as the slope of a secant line, and explain what it means in context with correct units.

Key Takeaways
- The average rate of change over the closed interval [a, b] equals the slope of the secant line from (a, f(a)) to (b, f(b)), computed as (f(b) - f(a)) / (b - a).
- A linear function has a constant average rate of change over any interval, so its rates of change are changing at a rate of zero.
- A quadratic function's average rates of change over consecutive equal-length intervals can be described by a linear function, so those rates change at a constant rate.
- Increasing average rates over small equal-length intervals mean the graph is concave up; decreasing average rates mean concave down.
- Always pair a rate value with its meaning and units when a context is given.
Average Rates of Change
A linear function produces a straight-line graph. Its average rate of change over any input-value interval is constant, because the slope stays the same everywhere along the line.
A quadratic function has a squared term in the input, so its graph is a curve. Its average rate of change is not constant. Instead, when you compute the average rates of change over consecutive equal-length input intervals, those values can be given by a linear function.
The average rate of change over a closed interval [a, b] measures how much the output changes on average per unit change in input over that interval.
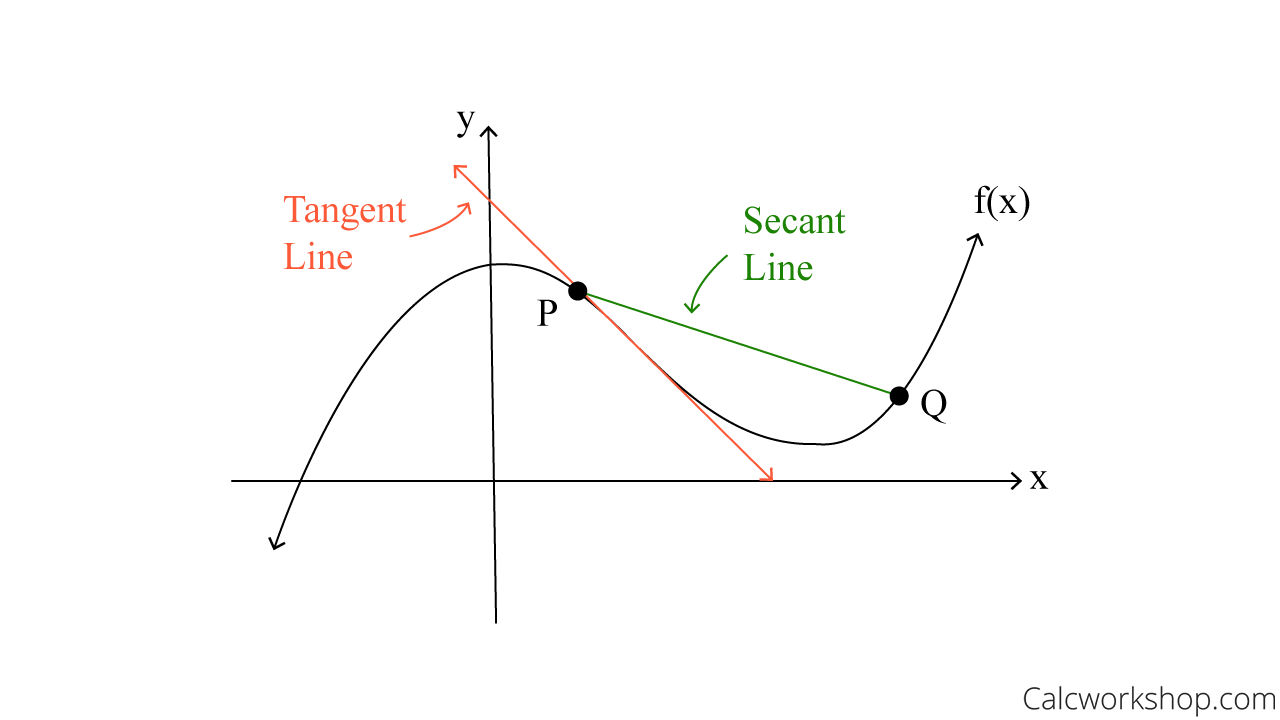
You can picture it as a line connecting two points on the graph, (a, f(a)) and (b, f(b)). This line is the secant line, and its slope is the average rate of change over [a, b]:
Change in Average Rates of Change
A linear function has a constant rate of change across its whole domain. So the average rate of change over consecutive equal-length input intervals is given by a constant function, which means these average rates are changing at a rate of zero. The function is not speeding up or slowing down.
For a quadratic function, the rate of change is not constant. But the average rates of change over consecutive equal-length input intervals can be given by a linear function. That means the average rates of change for a quadratic are changing at a constant rate, even though the rate of change itself is not constant. Whether the function speeds up or slows down depends on the sign of the leading coefficient.
A Note on Concavity
When the average rate of change over equal-length input intervals is increasing for all small intervals, the graph is curving upward, or concave up.
When the average rate of change over equal-length input intervals is decreasing for all small intervals, the graph is curving downward, or concave down.
Concavity tells you a lot about how a function behaves, including where its high and low points tend to be.
How to Use This on the AP Precalculus Exam
MCQ
- Read tables carefully. To find an average rate of change between two rows, use (f(b) - f(a)) / (b - a). The interval does not need to start at zero.
- If the average rates over equal-length intervals are all equal, the function is linear. If those average rates change by a constant amount each step, the function is quadratic.
- Use the sign of the average rate to describe direction: a positive rate means output increases as input increases, and a negative rate means output decreases as input increases.
Free Response
- Show the secant slope setup, not just the final number. Writing (f(b) - f(a)) / (b - a) with the actual values makes your work clear.
- When a context is given, state what the rate means and include units, such as "the average rate of change is 0.4 cubic meters per minute."
- If asked about concavity, connect it to whether average rates of change are increasing or decreasing over small equal-length intervals.
Common Trap
- Average rate of change is the slope of the secant line, not the value of the function at a point. Avoid plugging in a single x-value when the question asks for a rate over an interval.
Common Misconceptions
- A quadratic does not have a constant average rate of change. What is constant is the rate at which its average rates change, because those average rates follow a linear pattern.
- The average rate of change over [a, b] is not f(b) - f(a). You must divide by the change in input, b - a.
- Concavity is about whether the rate of change is increasing or decreasing, not about whether the function itself is increasing or decreasing. A function can be decreasing while still concave up.
- A secant line and a tangent line are different. The secant connects two points and gives an average rate over an interval, while a tangent touches at one point.
- A larger average rate of change does not always mean larger output values. It describes how fast the output is changing over the interval, not how big the output is.
Related AP Precalculus Guides
Vocabulary
The following words are mentioned explicitly in the AP® course framework for this topic.Term | Definition |
|---|---|
average rate of change | The change in the output of a function divided by the change in the input over a specified interval, calculated as (f(b) - f(a))/(b - a) for the interval [a, b]. |
concave down | A characteristic of a graph where the rate of change is decreasing, creating a curve that opens downward. |
concave up | A characteristic of a graph where the rate of change is increasing, creating a curve that opens upward. |
constant rate | A rate of change that remains the same across all intervals; for quadratic functions, the rate at which average rates of change are changing. |
equal-length input-value intervals | Consecutive intervals along the input axis that have the same width, used to compare average rates of change. |
linear function | A polynomial function of degree 1 with the form f(x) = mx + b, representing a constant rate of change. |
quadratic function | A polynomial function of degree 2 with the form f(x) = ax² + bx + c, creating a parabolic graph. |
secant line | A line that intersects a curve at two points, used to represent the average rate of change between those points. |
sequence | A function from the whole numbers to the real numbers, producing a list of ordered values. |
slope | The rate of change of a line, representing how much the output changes for each unit change in the input. |
Frequently Asked Questions
What is average rate of change?
Average rate of change measures how much a function's output changes per unit change in input over an interval. Graphically, it is the slope of the secant line through the endpoints.
How do you calculate average rate of change on [a, b]?
Use the formula (f(b) - f(a)) / (b - a). This compares the change in output to the change in input over the interval from a to b.
How are rates of change different for linear and quadratic functions?
A linear function has the same average rate of change over every interval. A quadratic function has average rates of change over equal-length intervals that follow a linear pattern.
What do consecutive equal-length intervals show?
Consecutive equal-length intervals help reveal whether average rates stay constant or change by a constant amount. Constant rates suggest a linear function, while rates that change linearly suggest a quadratic function.
How is AP Precalculus 1.3 tested?
AP Precalculus 1.3 is tested with equations, tables, graphs, and contexts. Be ready to compute secant slopes, compare equal-length intervals, identify linear or quadratic patterns, and explain rates with units.