📈AP Pre-Calculus Unit 2 Review
2.6 Competing Function Model Validation
2.6 Competing Function Model Validation
Unit & Topic Study Guides
Unit 1 – Polynomial and Rational Functions
Unit 2 – Exponential and Logarithmic Functions
Unit 3 – Trigonometric and Polar Functions
Unit 4 – Functions Involving Parameters, Vectors, and Matrices
AP Precalculus Exam
Mathematical Practices
TLDR
Topic 2.6 in AP Precalculus is about building linear, quadratic, and exponential models from a data set and then checking whether the model you chose actually fits. The main tool for validation is the residual plot: if the residuals scatter randomly with no pattern, the model is appropriate. If the residuals show a clear shape, you picked the wrong model.

Why This Matters for the AP Precalculus Exam
This topic ties together everything you learned about linear, quadratic, and exponential behavior and pushes you to decide which one a real data set fits best. On the AP Precalculus exam, you may need to construct a regression model with your graphing calculator, read a residual plot, and justify your choice in words.
That justification step is where students gain or lose points. You will often be asked to explain why a model is appropriate using the residual plot, or to interpret whether an error is an overestimate or underestimate in context. Clear reasoning and correct vocabulary are important for strong exam work here, especially on free-response questions where answers without supporting work may not earn credit.
Calculator skills matter too. You should be fluent with entering data, running linear, quadratic, and exponential regressions, and plotting residuals before exam day.
Key Takeaways
- Linear, quadratic, and exponential models can all fit data with a slightly changing rate of change, so you compare them instead of assuming one.
- Use contextual clues and the shape of the data to decide which model is most appropriate, not just which equation looks neat.
- A model is justified as appropriate when its residual plot shows no pattern.
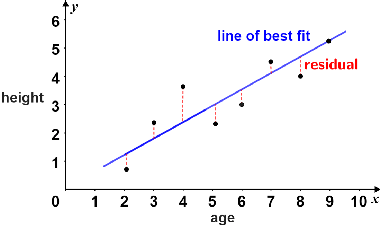
- A residual is the actual dependent-variable value minus the dependent-variable value predicted by the regression model.
- Error matters in context: sometimes an overestimate is safer, sometimes an underestimate is safer.
- Be ready to run regressions and residual plots on your calculator and explain your choice clearly.
Choosing Between Linear, Quadratic, and Exponential Models
When two variables in a data set show a slightly changing rate of change, linear, quadratic, and exponential models can all be candidates. Each one captures a different kind of pattern, so part of your job is matching the model to how the data actually changes.
- Linear functions of the form have a constant rate of change. The slope is the same everywhere. These fit data that follows a straight-line pattern.
- Quadratic functions of the form have a rate of change that changes at a constant amount. The sign of decides whether the parabola opens up or down. These fit data that rises and then falls (or falls and then rises) in a curved, parabolic pattern.
- Exponential functions of the form have a rate of change that grows or shrinks proportionally. The base is a positive number other than 1. These fit data that shows growth or decay, where each step multiplies rather than adds.
To compare models, look at how the data changes. Is the rate of change roughly constant? Does it speed up, slow down, or switch direction? Comparing the candidate models to the data and to the context tells you which one is most appropriate for making predictions.
Context also helps you choose. Think about which quantity is independent (your ) and which is dependent (your ), and consider what the model is for. A simpler model that is easy to interpret can be the better choice, but sometimes a more flexible model fits the data noticeably better. Weigh fit against simplicity.
Validating a Model With Residuals
Once you have a model, you check whether it is appropriate by looking at the residuals. A residual is the actual value of the dependent variable minus the value the regression model predicts for that same independent-variable input.
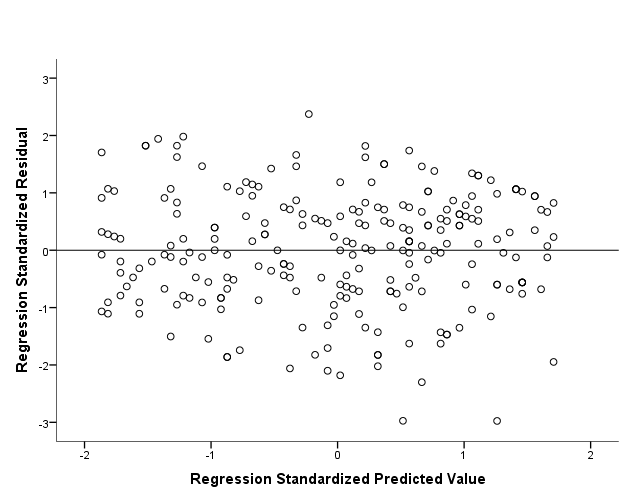
A residual plot puts the independent variable on the horizontal axis and the residuals on the vertical axis. A model is justified as appropriate when the residual plot shows no pattern. The residuals should scatter randomly around zero with no clear trend.
If the residuals show a shape, like a curve, a line, or a wave, that pattern is a signal the model does not match the data. A leftover curve in the residuals often means the true relationship bends more than your model does, so a different model type may fit better.
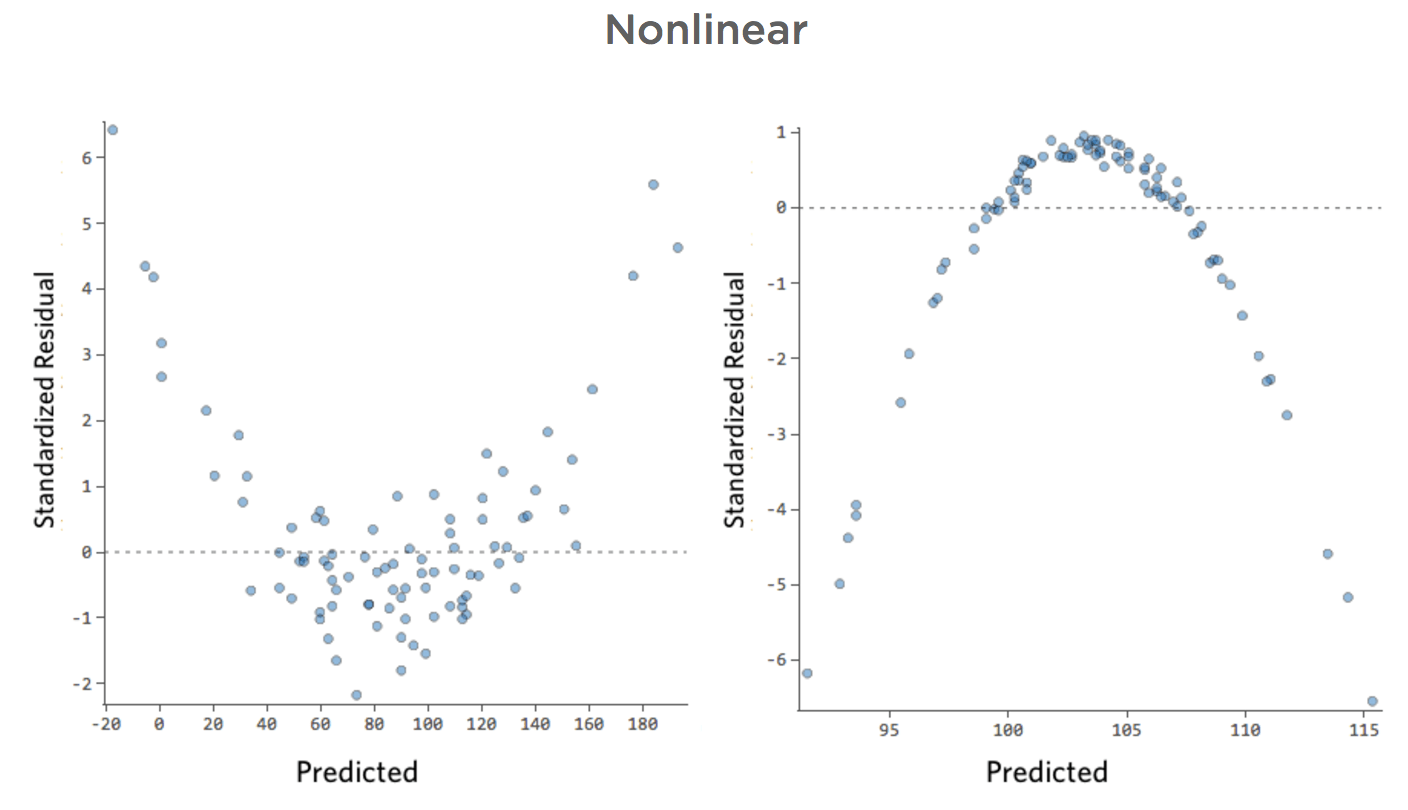
No model fits perfectly, so some random scatter is normal and expected. The key question is whether there is structure left over. Random scatter means the model is doing its job. A clear pattern means you should reconsider the model.
Error and Why Over or Underestimating Matters
The error in a model is the difference between predicted and actual values. Depending on the data set and the context, it can be better to have an underestimate or an overestimate over a given interval.
- Predicting how many patients a hospital needs to staff for: an overestimate can be safer, since having extra capacity beats running short.
- Predicting how much money you will have in an account: an underestimate can be safer, so you plan around the lower amount and avoid overspending.
The signed error, whether you are predicting too high or too low, can matter as much as the size of the error. When you interpret a model on the exam, connect the direction of the error back to the situation.
How to Use This on the AP Precalculus Exam
Problem Solving
- Enter the data into your calculator and run linear, quadratic, and exponential regressions so you can compare fits.
- Generate the residual plot for the model you are testing. Look at the pattern, not just the size of the residuals.
- Read the data's rate of change before committing: constant change points toward linear, constant change in the rate points toward quadratic, proportional change points toward exponential.
Free Response
- When asked to justify a model, name the residual plot and state that it shows no pattern. That is the standard justification.
- If the residual plot shows a clear shape, say so and explain that the model is not appropriate.
- Show your steps when building or solving with a model. Answers without supporting work may not support a stronger score.
- When a question involves error, state whether it is an overestimate or underestimate and tie that to the context.
Common Trap
- Do not pick a model just because the equation looks clean or the -type number on your calculator looks high. The residual plot is your evidence on this exam.
Common Misconceptions
- "A high correlation number proves the model is right." On this topic, the residual plot is the tool you use to justify appropriateness. A patternless residual plot is the evidence, not a single fit number.
- "A residual is just the size of the error." A residual is the actual value minus the predicted value, so it has a sign. Errors in a model can be discussed as signed differences or as unsigned absolute residuals. The sign tells you whether the model is overpredicting or underpredicting at that point, and the context can make one kind of error more acceptable than the other.
- "If the model fits visually, the residuals do not matter." A model can look close on a scatterplot while its residuals still curve. The leftover pattern reveals the mismatch.
- "Quadratic and exponential are basically the same since both curve." Quadratic change is a changing rate of change by addition and can turn around, while exponential change multiplies and stays always increasing or always decreasing.
- "Smaller error is always the goal." Sometimes the context makes an overestimate or an underestimate the safer choice, so direction of error can matter more than just minimizing it.
Related AP Precalculus Guides
Vocabulary
The following words are mentioned explicitly in the AP® course framework for this topic.Term | Definition |
|---|---|
data set | A collection of numerical values or observations that represent measurements or information about variables. |
error | The difference between a model's predicted value and the actual observed value in a data set. |
exponential model | A mathematical model of the form y = ab^x that describes data or phenomena exhibiting exponential growth or decay. |
linear model | A mathematical representation of a linear relationship, expressed in the form y = mx + b, where m is the slope and b is the y-intercept. |
model | A mathematical representation constructed from a data set to describe relationships or predict values. |
overestimate | A predicted value that is greater than the actual observed value. |
quadratic model | A mathematical representation of a relationship between two variables using a quadratic function of the form f(x) = ax² + bx + c. |
rate of change | The measure of how quickly a function's output changes relative to changes in its input. |
regression | A statistical method for fitting a function to a data set to model the relationship between variables. |
residual plot | A graph displaying the residuals of a regression model, used to assess whether a model is appropriate for a data set. |
residuals | The differences between the predicted values from a regression model and the actual observed values in a data set. |
underestimate | A predicted value that is less than the actual observed value. |
Frequently Asked Questions
What is competing function model validation in AP Precalculus?
It means comparing possible function models, usually linear, quadratic, and exponential, and deciding which model is most appropriate for a data set based on context and residual behavior.
How do you choose between linear, quadratic, and exponential models?
Look at the rate of change, the shape of the data, and the context. Linear models fit roughly constant change, quadratic models fit curved patterns with changing rate of change, and exponential models fit proportional growth or decay.
What is a residual?
A residual is the actual data value minus the value predicted by the model. Residuals show how far the model’s predictions are from the observed data.
How do residual plots validate a model?
A model is appropriate when the residual plot shows random scatter with no clear pattern. A curve, trend, or wave in the residuals suggests the model is missing structure in the data.
Why does overestimating or underestimating matter?
The direction of error matters because context determines which mistake is worse. In some situations an overestimate is safer, while in others an underestimate is more useful.
What should I write on an AP Precalculus model validation FRQ?
Name the model, cite the residual plot, state whether it has a pattern, and connect the conclusion to the context. Do not rely only on an equation or correlation value.