👩🏽🔬Honors Chemistry Unit 2 Review
2.1 Scientific Method in Chemistry
2.1 Scientific Method in Chemistry
Unit & Topic Study Guides
Introduction to Chemistry
Scientific Measures & Calculations
Atoms and the Periodic Table
Chemical Bonding
Chemical Quantities & Stoichiometry
Gases and Gas Laws
Solutions and Solubility
Thermochemistry
Chemical Kinetics and Equilibrium
Acids, Bases, and pH
Redox Reactions & Electrochemistry
Organic Chemistry
Scientific Method in Chemistry
The scientific method is the systematic process scientists use to investigate questions, test ideas, and build reliable knowledge. Every experiment you design in this course will follow this framework, so understanding it well now pays off throughout the year.
The scientific method developed over centuries through thinkers like Galileo and Francis Bacon, who pushed for testing ideas through repeatable experiments rather than relying on authority or assumption.

The Scientific Method: A Systematic Approach
The scientific method is a structured approach used to explore observations, answer questions, and test hypotheses. Each step builds on the one before it, creating a cycle of inquiry and refinement.
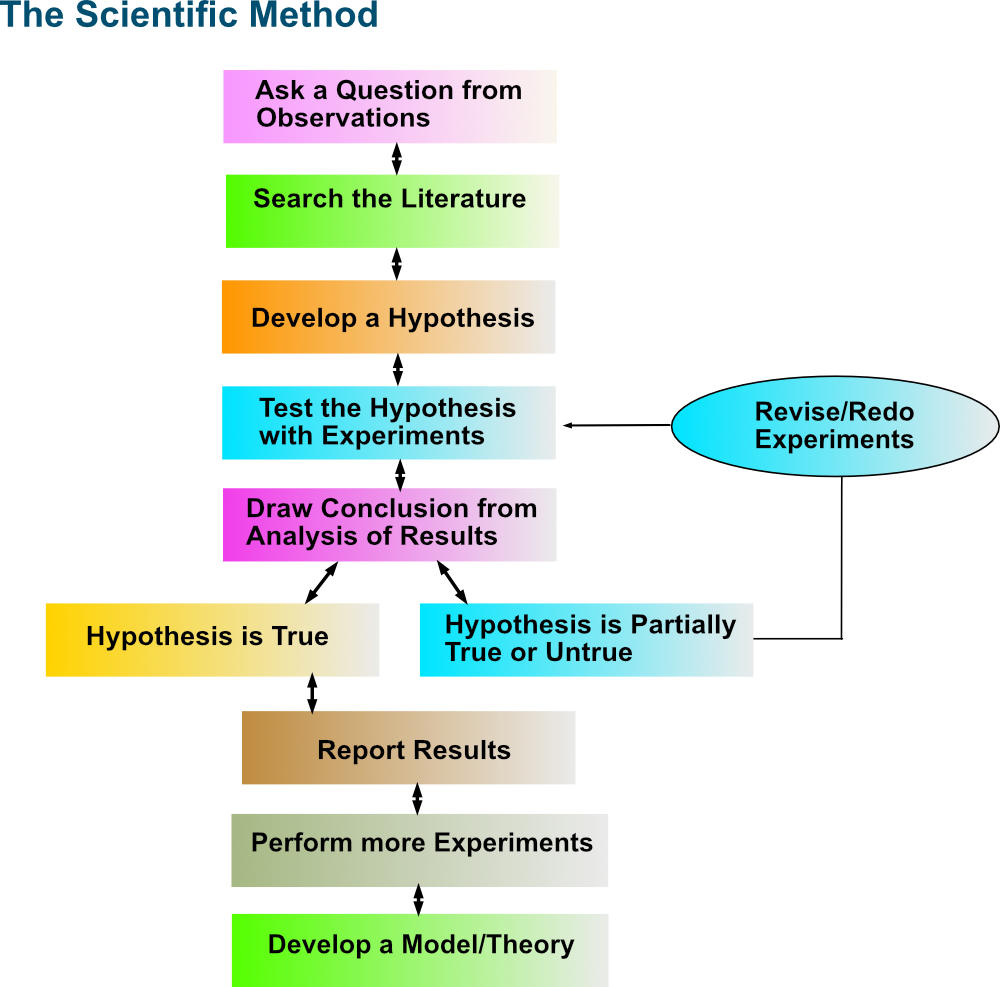
Step-by-step visual representation of the scientific method.
Image Courtesy of Pathways to Chemistry.
Steps of the Scientific Method
1. Observation
Every investigation starts with noticing something. Observations can be straightforward (salt dissolves in water) or more complex (noticing that certain metal catalysts speed up reactions more than others).
Good observations depend on good measurements, which brings up two terms you'll see constantly:
- Accuracy refers to how close a measurement is to the true or accepted value.
- Precision refers to how close repeated measurements are to each other.
A measurement can be precise but not accurate (you get the same wrong answer every time), or accurate but not precise (your answers scatter around the true value). Ideally, you want both.
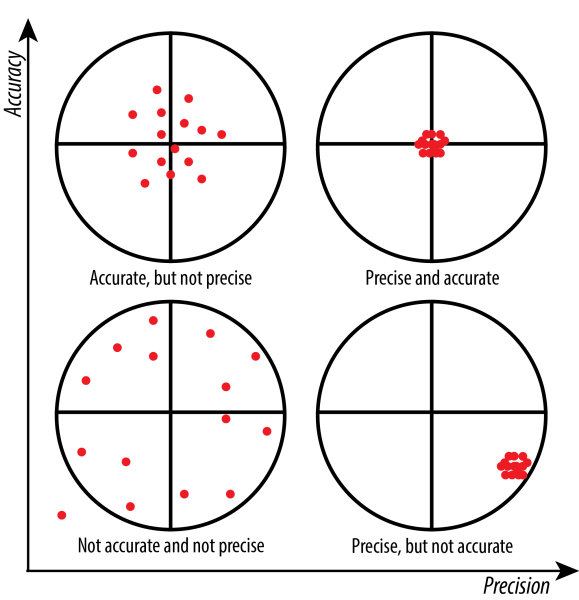
Graphic with four different targets, expressing the difference between accuracy and precision.
Image Courtesy of St. Olaf College.
Curiosity drives this step. When you notice something unusual or unexpected, you naturally start asking why, and that question launches the rest of the process.
2. Research: Building on What We Know
Before designing an experiment, you need to find out what's already known about your question. This means:
- Searching existing studies through libraries, textbooks, or online databases (like PubMed or Google Scholar).
- Understanding the background science so your hypothesis is grounded in real knowledge, not just a random guess.
3. Hypothesis: The Testable Prediction
A hypothesis is a specific, testable prediction about what will happen under certain conditions. You form it by combining your observations (step 1) with your research (step 2).
Two key requirements for a good hypothesis:
- Testable: You must be able to design an experiment that could either support or refute it.
- Specific: Vague predictions like "something will change" aren't useful. State what you expect to happen and why.
Don't confuse a hypothesis with a theory. A theory is a well-tested explanation supported by a large body of evidence across many experiments. A hypothesis is your starting prediction for a single investigation.
4. Experiment: Testing the Hypothesis
This is where you design and carry out a controlled procedure to test your hypothesis.
- Always follow lab safety protocols. Safety comes before data.
- Ethical considerations matter too. Experiments should be designed honestly, and results should never be fabricated or selectively reported.
5. Analyze Data and Draw Conclusions
After running your experiment, you collect and organize your data, then determine what it means.
- Keep all data documented in one place so your findings are clear and shareable.
- Ask yourself: did the results support your hypothesis, or did they contradict it? Both outcomes are valuable.
If your hypothesis wasn't supported, that's not failure. It's new information. You can form a revised hypothesis based on what you learned and run another experiment.
Considerations in Experimentation
Designing a good experiment requires you to think carefully about what you're testing, what you're measuring, and what you're holding constant.
Variables in an Experiment
Independent Variable (IV)
The IV is the factor you deliberately change. On a graph, it's typically plotted on the x-axis.
- Example: Changing the concentration of a reactant to see how it affects reaction rate.
Dependent Variable (DV)
The DV is what you measure in response to changes in the IV. It goes on the y-axis.
- Example: Measuring the time it takes for a reaction to complete after you've changed the reactant concentration.
Control Variables
These are all the factors you keep constant so that any change in the DV can be attributed to the IV alone.
- Example: In a gas law experiment, you'd hold temperature and the amount of gas constant if you're testing how volume affects pressure.
Putting It Together: A Sample Experiment
Suppose you want to investigate how changes in temperature affect the pressure of a gas in a sealed container (this relates to Gay-Lussac's Law, not Boyle's Law, since Boyle's Law describes the pressure-volume relationship at constant temperature).
- Independent variable: Temperature of the gas (tested at low, room, and high temperatures)
- Dependent variable: Pressure of the gas inside the sealed container
- Control variables: Volume of the container (sealed), type of gas, amount of gas, atmospheric conditions, and time intervals for data collection
Data Collection and Analysis
Once your experiment is running, you collect two types of data:
- Quantitative data is numerical (mass in grams, volume in mL, temperature in °C).
- Qualitative data is descriptive (color changes, formation of a precipitate, odor).
Use appropriate tools for precise measurements: electronic balances for mass, graduated cylinders or pipettes for volume, thermometers or probes for temperature.
When analyzing your data, look for trends and patterns. Calculate any relevant errors. Both human error (misreading a scale) and equipment limitations (a balance that only reads to 0.1 g) can affect your results. Identifying these sources of error helps you improve your next experiment.
After analysis, interpret your findings relative to your hypothesis. If there were anomalies, consider possible causes: contamination, measurement inaccuracies, or uncontrolled variables.
Reevaluation and Repetition
Once you've analyzed your data and reflected on sources of error, the next step is to repeat the experiment. Repetition strengthens validity because it shows whether your results are reproducible. If other people can replicate your findings, that's strong evidence your conclusions are reliable.
If results differ from your original hypothesis, modify the hypothesis based on the new evidence and test again. This cycle of testing, analyzing, and refining is what makes the scientific method so powerful.
Why This Matters in Chemistry
Chemistry is built on this process. Every reaction mechanism, every law, every model you'll study this year was developed through repeated cycles of observation, hypothesis, experimentation, and revision. Understanding the scientific method doesn't just help you on exams; it gives you the framework for thinking critically about any claim or result you encounter.