🔌Intro to Electrical Engineering Unit 17 Review
17.1 Signal classification and representation
17.1 Signal classification and representation
Unit & Topic Study Guides
Intro to Electrical Engineering
Electrical Quantities and Units
Ohm's Law: Understanding Resistance
Kirchhoff's Laws in Electrical Engineering
Circuit Analysis Techniques
Capacitance and Inductance
Transient Response: First-Order Circuits
Steady-State Sinusoidal Analysis
Semiconductor Basics in Electrical Engineering
Diodes and Circuits
BJTs: Bipolar Junction Transistors
Field-Effect Transistors in Electronics
Digital Systems Fundamentals
Boolean Algebra & Logic Gates
Combinational Logic Circuits
Sequential Logic Circuits
Signal Processing Fundamentals
Continuous-Time Signals & Systems
Fourier Series and Transforms
Sampling and Discrete-Time Signals
Z-Transforms in Discrete-Time Systems
Circuit Simulation Tools Overview
System Modeling & Analysis Tools
Case Studies in Electrical Engineering
Signal Types
Signals are the foundation of signal processing. A signal is any quantity that varies over time (or space) and carries information. Classifying signals correctly tells you which mathematical tools and system designs apply, so this is where everything else in the unit builds from.
Continuous and Discrete Signals
These two categories describe when a signal is defined.
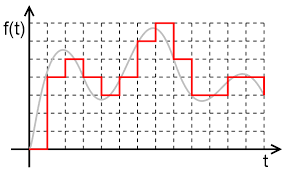
- Continuous-time signals are defined for every value of time and can take on a smooth continuum of values. Natural phenomena like temperature, air pressure, and sound waves produce continuous-time signals.
- Discrete-time signals are defined only at specific, separated time instants. They're typically written as a sequence , where is an integer index. You usually get discrete-time signals by sampling a continuous-time signal at regular intervals spaced apart.
Think of a continuous-time signal as a smooth curve you could draw without lifting your pen. A discrete-time signal is a series of dots along that curve, one dot every seconds.
Analog and Digital Signals
These two categories describe what values a signal can take.
- Analog signals can take any value within a continuous range. A voltage that smoothly varies between 0 V and 5 V is analog.
- Digital signals can only take a finite number of distinct values, often represented as binary digits (bits). For example, an 8-bit digital signal has only 256 possible values.
Analog signals are typically continuous-time, and digital signals are typically discrete-time, but these are separate concepts. Converting from analog to digital requires two steps:
- Sampling — measure the analog signal at regular time intervals (this makes it discrete-time).
- Quantization — round each sample to the nearest allowed value (this makes it digital).
This two-step process is what an analog-to-digital converter (ADC) performs.
Signal Periodicity
Periodic Signals
A signal is periodic if it repeats exactly after some fixed time interval called the period :
The smallest such is the fundamental period. From it you get the fundamental frequency:
Common periodic signals include sinusoidal waves, square waves, and sawtooth waves. Any periodic signal also contains harmonics, which are frequency components at integer multiples of (i.e., ). You'll see this become important when you study Fourier series.
Aperiodic Signals
Aperiodic signals don't repeat at a regular interval. They fall into two subcategories:
- Almost periodic signals are made up of multiple periodic components whose periods are not integer multiples of each other. They may look close to repeating but never exactly do.
- Non-periodic signals have no repeating pattern at all. Transient pulses and random noise are common examples.
Signal Predictability
Deterministic Signals
A deterministic signal is one you can describe with a mathematical function. If you know the function, you can calculate the signal's exact value at any time. Sinusoidal waves (), exponential decays, and polynomial functions are all deterministic.
Deterministic signals can be either periodic or aperiodic. A single decaying exponential, for instance, is deterministic but not periodic.
Random Signals
A random (stochastic) signal can't be predicted exactly at any given time. You can't write a single formula that tells you its future values. Instead, you describe random signals using statistical properties:
- Mean — the average value
- Variance — how spread out the values are
- Probability density function (PDF) — the likelihood of different values occurring
Thermal noise in a resistor and shot noise in a semiconductor are classic examples. Random signals are further classified as stationary (statistical properties stay constant over time) or non-stationary (statistical properties change over time).
Signal Representation
The same signal can be viewed in two complementary ways. Neither is "better"; they reveal different information.
Time-Domain Representation
The time-domain shows a signal as a function of time, . You see how the amplitude changes moment to moment. This view is most useful for:
- Observing transient events (a sudden spike or pulse)
- Measuring peak amplitude or signal duration
- Analyzing how a system responds to a specific input over time
Plotting a waveform on an oscilloscope is time-domain analysis.
Frequency-Domain Representation
The frequency-domain shows a signal as a function of frequency, . You get this by applying the Fourier transform to the time-domain signal. This view tells you which frequencies are present and how strong each one is. It's most useful for:
- Identifying the bandwidth of a signal (the range of frequencies it occupies)
- Analyzing periodic signals by their harmonic content
- Designing filters that pass certain frequencies and block others
Plotting a frequency spectrum on a spectrum analyzer is frequency-domain analysis.
A pure sine wave at 1 kHz appears as a single spike at 1 kHz in the frequency domain. A square wave at 1 kHz shows spikes at 1 kHz, 3 kHz, 5 kHz, and so on (odd harmonics), which illustrates why the frequency-domain view is so powerful for understanding signal structure.