🥀Intro to Botany Unit 10 Review
10.5 Plant bioinformatics and data analysis
10.5 Plant bioinformatics and data analysis
Unit & Topic Study Guides
Plant Anatomy and Morphology
Plant physiology
Plant Genetics & Evolution
Plant Classification and Naming Systems
Plant Ecology and Ecosystems
Plant Biochemistry & Metabolism
Plant Reproduction & Growth
Economic & Ethnobotany
Plant Diseases: Causes and Management
Botanical Research Methods
Plant Conservation & Biodiversity
Bioinformatics for Plant Research
Plant bioinformatics applies computational tools to analyze biological data from plants, helping researchers understand plant genetics, physiology, and ecology. This field covers the study of plant genomes, transcriptomes, proteomes, and metabolomes, connecting molecular data to real-world questions about evolution, crop improvement, conservation, and biotechnology.
The major areas covered here are genomic data analysis, transcriptomics, proteomics, and metabolomics. Each uses specialized databases and software to make sense of massive datasets that would be impossible to interpret by hand.
Genomic Data Analysis
Genomic data analysis uses computational approaches to study plant genomes and uncover the genetic basis of plant traits. It involves generating, processing, and interpreting large-scale DNA sequencing data to identify genes, regulatory elements, and genetic variations. These analyses provide a foundation for understanding plant evolution, domestication, and adaptation to different environments.
DNA Sequencing Technologies
Three generations of sequencing technology are relevant to plant bioinformatics:
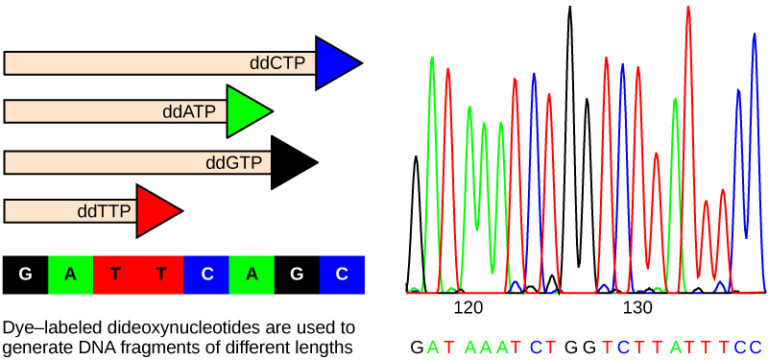
- Sanger sequencing (first-generation) uses the chain-termination principle. It's accurate but low-throughput, so it's best suited for targeted sequencing of specific genes or small regions.
- Next-generation sequencing (NGS) platforms like Illumina (short reads) and Pacific Biosciences (long reads) can sequence entire plant genomes or transcriptomes in a single run.
- Third-generation sequencing technologies like Oxford Nanopore produce ultra-long reads in real time. These are especially useful for assembling complex plant genomes that contain polyploidy or highly repetitive regions, which short reads struggle to resolve.
Genome Assembly and Annotation
Genome assembly is the process of reconstructing a complete DNA sequence from many short or long sequencing reads. Different read types require different algorithms:
- De Bruijn graph algorithms work well for short reads (like Illumina data)
- Overlap-layout-consensus algorithms are designed for long reads
Both approaches stitch reads into contiguous sequences called contigs, which are then organized into larger scaffolds.
Genome annotation comes next. This is where you identify what's actually in the assembled genome: gene locations, regulatory elements, repetitive sequences, and their functions. Annotation tools like MAKER and AUGUSTUS combine evidence from transcriptome data, protein homology searches, and ab initio (prediction-based) gene finding to produce accurate annotations.
Comparative Genomics of Plants
Comparative genomics compares genomes from different plant species to find conserved and divergent features, such as shared gene families, syntenic regions (blocks of genes in the same order across species), and evolutionary relationships.
This approach is valuable for studying:
- Genome duplication events (polyploidy)
- Gene loss and gain over evolutionary time
- The emergence of novel traits like stress tolerance
Specific methods include phylogenomics (using genome-wide data to build evolutionary trees) and synteny analysis (comparing gene order across species). These help trace the evolutionary history of plants and identify genetic changes linked to crop domestication.
Functional Genomics and Gene Expression
Functional genomics goes beyond identifying genes to understanding what those genes actually do in the context of plant development, physiology, and environmental responses.
- Gene expression profiling techniques like microarrays and RNA-seq quantify how active each gene is across different tissues, developmental stages, or experimental treatments.
- Reverse genetics approaches test gene function directly. T-DNA insertion mutagenesis knocks out a gene by inserting foreign DNA into it, while CRISPR-Cas9 genome editing allows precise modifications. Researchers then observe the phenotypic effects.
- Integrative analysis combines gene expression data with proteomics and metabolomics data to build a systems-level picture of how plant biological processes and regulatory networks operate.
Transcriptomics and RNA-seq
Transcriptomics studies the complete set of RNA transcripts (the transcriptome) in a plant cell or tissue under specific conditions. RNA-seq is the primary high-throughput method for this, allowing researchers to quantify and characterize mRNAs, non-coding RNAs, and alternative splicing events. Transcriptomic analysis reveals gene expression dynamics, regulatory mechanisms, and functional pathways involved in plant growth, development, and stress responses.
RNA-seq Experimental Design
Careful experimental design is critical for meaningful RNA-seq results. Key considerations include:
- Sample type: Which tissue? Which developmental stage?
- Biological replicates: Multiple independent samples per condition (typically 3 or more) to distinguish real biological differences from noise
- Sequencing depth: How many reads per sample? More reads detect lower-abundance transcripts but cost more.
- Library preparation: Paired-end sequencing is generally preferred over single-end because it provides better transcript coverage and helps identify splice junctions and fusion transcripts.
- Strand specificity: Strand-specific RNA-seq protocols preserve information about which DNA strand a transcript came from, enabling accurate quantification of antisense transcripts and overlapping genes.
Quality Control and Preprocessing
Before analyzing RNA-seq data, you need to assess its quality and clean it up:
- Quality assessment: Tools like FastQC and MultiQC generate reports on sequencing quality metrics, including per-base sequence quality, GC content, and duplication levels.
- Trimming: Remove low-quality bases from read ends using tools like Trimmomatic or Cutadapt.
- Adapter removal: Strip out adapter sequences that were added during library preparation (same tools as trimming).
- Contaminant filtering: Remove ribosomal RNA (rRNA) or other unwanted sequences using tools like SortMeRNA or Bowtie2.
Differential Expression Analysis
Differential expression analysis identifies genes that are significantly up- or down-regulated between conditions (for example, control vs. drought-stressed, or wild-type vs. mutant).
The typical workflow:
- Read alignment: Map preprocessed reads to a reference genome or transcriptome using tools like STAR or HISAT2. This produces a count matrix showing how many reads mapped to each gene.
- Statistical testing: Tools like DESeq2 and edgeR model the count data using a negative binomial distribution and test for significant expression differences with generalized linear models.
- Downstream analysis: Differentially expressed genes (DEGs) are analyzed for functional enrichment using Gene Ontology (GO) terms or KEGG pathway databases.
- Visualization: Results are commonly displayed as heatmaps, volcano plots, or MA plots.

Gene Co-expression Networks
Gene co-expression networks (GCNs) group genes based on how similarly they're expressed across many samples or conditions. If two genes consistently go up and down together, they may be co-regulated or involved in the same biological process.
- WGCNA (Weighted Gene Co-expression Network Analysis) is the most widely used method. It calculates topological overlap between genes and identifies modules of co-expressed genes, along with hub genes that are highly connected within each module.
- GCNs can be combined with other data types, such as protein-protein interactions and transcription factor binding sites, to infer regulatory relationships and prioritize candidate genes for further study.
Proteomics in Plant Biology
Proteomics is the large-scale study of proteins, covering their abundance, structure, function, and interactions in plant cells or tissues. It complements transcriptomics because mRNA levels don't always predict protein levels. Post-transcriptional regulation, protein turnover, and modifications all affect what proteins are actually present and active. Applications include identifying stress-responsive proteins, characterizing protein complexes, and discovering biomarkers for crop improvement.
Protein Extraction and Separation
Extracting proteins from plant tissues is trickier than from animal tissues because plant cells have rigid cell walls and contain secondary metabolites (like phenolics and terpenes) that can interfere with analysis.
Common extraction methods:
- TCA/acetone precipitation: Effective at removing contaminants
- Phenol extraction: Good for tissues rich in secondary metabolites
- Detergent-based methods (using SDS or CHAPS): Solubilize membrane proteins
After extraction, complex protein mixtures are separated based on physicochemical properties:
- Two-dimensional gel electrophoresis (2-DE) separates proteins by isoelectric point in one dimension and molecular weight in the other
- Liquid chromatography (LC) separates proteins or peptides based on hydrophobicity or other properties
Mass Spectrometry-Based Proteomics
Mass spectrometry (MS) is the core technology in proteomics. It identifies and quantifies proteins based on their mass-to-charge ratios ().
- Tandem MS (MS/MS) fragments peptides and generates fragment ion spectra used for peptide sequencing and protein identification.
- Ionization techniques: Electrospray ionization (ESI) and matrix-assisted laser desorption/ionization (MALDI) convert peptides or proteins into gas-phase ions for MS analysis.
- Two main quantification strategies exist: shotgun proteomics (bottom-up), which digests proteins into peptides first, and targeted proteomics (using selected reaction monitoring or parallel reaction monitoring), which focuses on specific proteins of interest.
Protein Identification and Quantification
Protein identification works by matching experimental peptide mass spectra against theoretical spectra generated from a protein sequence database. Search algorithms like Mascot, SEQUEST, and MaxQuant assign statistical confidence scores to each match.
For quantification, two broad approaches are used:
- Label-free methods estimate protein abundance from the number of peptide-spectrum matches (spectral counting) or from signal intensity (XIC, iBAQ). These are simpler but can be less precise.
- Stable isotope labeling methods (SILAC, iTRAQ, TMT) chemically or metabolically tag proteins from different samples with distinct isotope labels, allowing multiplexed and more accurate quantification.
Post-translational Modifications
Post-translational modifications (PTMs) are covalent changes made to proteins after translation. They regulate protein function, localization, and interactions. Important PTMs in plants include:
- Phosphorylation: Key in signal transduction pathways
- Glycosylation: Affects protein folding and cell-cell recognition
- Ubiquitination: Marks proteins for degradation
- Methylation: Involved in epigenetic regulation
Because modified peptides are often low-abundance, enrichment strategies are needed before MS analysis. Immobilized metal affinity chromatography (IMAC) enriches for phosphopeptides, while lectin affinity chromatography captures glycopeptides. Bioinformatic tools like MaxQuant, Scaffold PTM, and SysPTM then identify and localize the modifications from MS data.
Metabolomics and Plant Metabolism
Metabolomics studies the small molecules (metabolites) present in plant cells, tissues, or organs, providing a snapshot of the plant's metabolic state at a given moment. Plant metabolites fall into two broad categories:
- Primary metabolites (sugars, amino acids, organic acids) are involved in core growth and development
- Secondary metabolites (alkaloids, terpenoids, phenolics) play roles in defense, pollinator attraction, and environmental interactions
Metabolomic analysis helps map metabolic pathways, identify bioactive compounds, and understand how plants respond to environmental stresses and biotic interactions.
Metabolite Profiling Techniques
Different analytical platforms detect different classes of metabolites:
- GC-MS (gas chromatography-mass spectrometry): Best for volatile and semi-volatile metabolites like sugars, amino acids, and organic acids. Samples typically require chemical derivatization first.
- LC-MS (liquid chromatography-mass spectrometry): Suited for non-volatile and thermally sensitive metabolites, including secondary metabolites, lipids, and peptides.
- CE-MS (capillary electrophoresis-mass spectrometry): Provides high-resolution separation of charged metabolites like central carbon metabolites and amino acids.
- NMR spectroscopy (nuclear magnetic resonance): Gives structural information and quantifies metabolites without separation, but has lower sensitivity than MS-based methods.
Targeted vs. Untargeted Approaches
These represent two fundamentally different strategies:
Targeted metabolomics quantifies a predefined set of known metabolites, often using multiple reaction monitoring (MRM) or selected ion monitoring (SIM). It's hypothesis-driven and provides accurate quantification, but you'll miss anything you didn't specifically look for.
Untargeted metabolomics aims to detect all measurable metabolites in a sample without prior assumptions. It's hypothesis-generating and can reveal novel metabolites or unexpected pathway changes. The tradeoff is that it requires extensive data processing and compound identification work.
Data Processing and Normalization
Raw metabolomics data requires several processing steps before it's useful:
- Peak detection: Identify individual metabolite signals in the raw data
- Alignment: Correct for retention time shifts between samples
- Integration: Quantify peak areas
Common tools include XCMS, MZmine, and MetAlign for MS data, and NMRProcFlow and rNMR for NMR data.
Normalization reduces technical variability so samples can be fairly compared. Methods include total ion current (TIC) normalization, median normalization, and probabilistic quotient normalization (PQN). Quality control (QC) samples, made from pooled aliquots of all samples, are run throughout the experiment to monitor analytical reproducibility and correct for instrument drift or batch effects.
Metabolic Pathway Analysis
Once metabolites are identified, pathway analysis maps them onto known biochemical pathways to find which pathways are overrepresented or disrupted under a given condition.
- Pathway databases like KEGG, BioCyc, and PlantCyc provide curated information on metabolic reactions and enzymes in plants.
- Analysis tools like MetaboAnalyst, MetExplore, and Cytoscape enable visualization, statistical testing (pathway enrichment, topology analysis), and integration with other omics data.
- Flux analysis methods, including flux balance analysis (FBA) and C metabolic flux analysis (MFA), go a step further by quantifying the actual flow of metabolites through a network, identifying which pathways are most active under different conditions.
Bioinformatics Tools and Databases
Bioinformatics tools and databases are the shared infrastructure that makes plant omics research possible. Publicly available resources give researchers access to genomes, transcriptomes, proteomes, metabolomes, functional annotations, and comparative analysis tools.
Sequence Alignment and Homology Search
Sequence alignment compares DNA, RNA, or protein sequences to find regions of similarity and infer evolutionary relationships. This is one of the most fundamental tasks in bioinformatics.
- Pairwise alignment: BLAST (Basic Local Alignment Search Tool) and FASTA search databases for sequences similar to a query and report statistical significance of matches.
- Multiple sequence alignment: Tools like MUSCLE, MAFFT, and T-Coffee align three or more sequences to identify conserved regions, motifs, or domains.
- Remote homology detection: PSI-BLAST and HMMer use position-specific scoring matrices (PSSMs) or hidden Markov models (HMMs) to find distantly related sequences that standard BLAST might miss.
Phylogenetic Analysis of Plant Species
Phylogenetic analysis reconstructs evolutionary relationships among plant species or genes using molecular sequence data.
Four main categories of methods exist:
- Distance-based (UPGMA, neighbor-joining): Fast but make simplifying assumptions
- Maximum parsimony: Finds the tree requiring the fewest evolutionary changes
- Maximum likelihood: Evaluates the probability of the data given a tree and evolutionary model
- Bayesian inference: Uses probability distributions to estimate tree topology and branch lengths
Common software includes MEGA, PHYLIP, and RAxML for tree construction and bootstrap analysis. Trees can be visualized and annotated with programs like iTOL, FigTree, and EvolView.
Gene Ontology and Functional Annotation
Gene Ontology (GO) provides a standardized vocabulary for describing gene function across three categories:
- Biological process: What the gene contributes to (e.g., photosynthesis)
- Molecular function: What the gene product does (e.g., kinase activity)
- Cellular component: Where the gene product is located (e.g., chloroplast)
GO annotations are machine-readable and consistent across species, making cross-species comparisons possible. Tools like Blast2GO, AgriGO, and PlantRegMap perform functional enrichment analysis, identifying which GO terms are overrepresented in a gene set (such as a list of differentially expressed genes). Pathway databases like KEGG and PlantCyc add another layer by annotating genes based on their roles in metabolic and signaling pathways.
Plant-Specific Databases and Resources
Several databases are tailored specifically for plant research:
- Phytozome: A comprehensive comparative plant genomics database with sequenced genomes, annotations, and analysis tools for over 200 plant species.
- TAIR (The Arabidopsis Information Resource): The go-to database for the model plant Arabidopsis thaliana, with detailed information on genes, proteins, metabolites, and genetic markers.
- Gramene: A curated resource for comparative genomics in crops and model species, integrating genome, pathway, and phenotype data.
- PLAZA: An online platform for comparative plant genomics, featuring tools for orthology analysis, functional annotation, and phylogenetic profiling across many plant species.
Data Integration and Systems Biology
Individual omics datasets each tell part of the story. Data integration and systems biology approaches combine multiple layers (genomics, transcriptomics, proteomics, metabolomics) to build a more complete picture of plant biological processes and their regulation. This integrative analysis can reveal key regulators, functional modules, and emergent properties that no single dataset could show on its own.
Multi-omics Data Integration
Multi-omics integration jointly analyzes different omics datasets to find correlations, co-expression patterns, and causal relationships among molecular components.
Statistical integration tools like mixOmics, MOFA, and DIABLO use methods such as canonical correlation analysis and partial least squares regression to find shared patterns across data types.
Network-based approaches like WGCNA and Bayesian networks incorporate multiple data types to infer functional modules and regulatory relationships.
Machine learning methods, including random forests, support vector machines, and deep learning, are increasingly used for integrative analysis and prediction of plant phenotypes from multi-omics data. These approaches can handle the high dimensionality and complexity of combined datasets, identifying patterns that traditional statistical methods might miss.