Age Structure Diagrams


An age structure diagram is a model that predicts the population growth rate by a shape. It shows a comparative ratio of males to females and the bars show various age groups from infants to adolescents to reproductive and post-reproductive stages. Certain age structure diagrams will have more representation at one end, while others will have more representation at the other end (or in the middle!).
- Pre-reproductive age: 0-14
- Reproductive age: 15-44
- Post-reproductive age: 45+
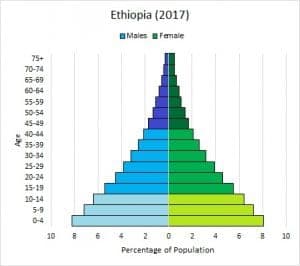
By using an age structure diagram, it can be predicted whether a population will increase, decrease or maintain stability. Predictions can also be made as to why this trend is showing: for example, is a population dying out because a majority of their individuals are above 45? The image below shows an age structure diagram for Ethiopia, and a classic example of a population in rapid growth. There are many more children in each generation than their parents, meaning that couples are having a lot of children. In this example the majority of the population is very young.
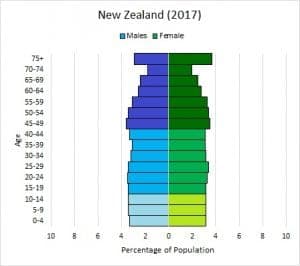
The diagram below shows New Zealand and an example of a population with stable numbers. This population has about the same amount of individuals in each age bracket. This suggests parents have access to reproductive education and can choose replacement level reproduction, or to have about two children per each couple.
In conclusion, age structure diagrams help us visualize at which point a society currently is in terms of average age and how they may react given a change in birth/death rate.
Vocabulary
The following words are mentioned explicitly in the College Board Course and Exam Description for this topic.
| Term | Definition |
|---|---|
| age structure diagrams | Visual representations of the distribution of a population by age groups, typically displayed as horizontal bar charts that show the proportion of males and females at each age level. |
| declining population | A population with a lower proportion of younger individuals compared to older individuals, indicating a decrease in population size over time. |
| population growth rate | The rate at which a population increases or decreases over time, which can be determined by analyzing the shape and proportions shown in age structure diagrams. |
| rapidly growing population | A population characterized by a high proportion of younger individuals relative to older individuals, typically indicated by a wide base in an age structure diagram. |
| stable population | A population with relatively equal proportions across age groups, indicating little change in population size over time. |
Frequently Asked Questions
What is an age structure diagram and how do I read it?
An age-structure diagram (population pyramid) shows the number or percent of people in age cohorts split by sex—usually pre-reproductive (0–14), reproductive (15–44), and post-reproductive (45+). Read it by the shape: an expansive pyramid (wide base) = lots of young people → rapid growth; a stationary shape (roughly equal widths) = slow or zero growth; a constrictive shape (narrow base) = declining population. Look at cohort widths to infer birth rate, mortality, life expectancy, and population momentum (young cohorts can keep growth going even if fertility falls). Use sex ratios and dependency ratio (young + old dependents ÷ working-age population) to judge social/economic pressure. These diagrams appear on the AP exam as visual representations and link to Topic 3.6 learning objective EIN-1.A. For a focused review, see the Topic 3.6 study guide (https://library.fiveable.me/ap-environmental-science/unit-3/age-structure-diagrams/study-guide/Dh16VKqnmPyH9TaTfLtY) and practice questions (https://library.fiveable.me/practice/ap-environmental-science).
Why do rapidly growing populations have more young people than old people?
Because an age-structure diagram (population pyramid) shows cohorts, a rapidly growing population has a wide base—meaning a high proportion in the pre-reproductive and reproductive cohorts. That happens when birth rate and fertility are high while mortality (especially infant/child mortality) has fallen less rapidly or life expectancy is still low. More births each year stack up lots of young people, so the pyramid expands downward. This shape indicates a positive population growth rate and population momentum: even if fertility later drops, the large young cohorts will produce many births, keeping growth going. Being able to read that shape and link it to birth rate, fertility, mortality, life expectancy, and momentum is exactly what the CED expects for Topic 3.6 (EK EIN-1.A.1–A.2). For a quick review, see the topic study guide (https://library.fiveable.me/ap-environmental-science/unit-3/age-structure-diagrams/study-guide/Dh16VKqnmPyH9TaTfLtY) and more practice at (https://library.fiveable.me/practice/ap-environmental-science).
I'm confused about how to tell if a population is growing or declining just by looking at these pyramid things - can someone explain?
Look at the shape by age cohorts (pre-reproductive, reproductive, post-reproductive). If the base (youngest cohort) is much wider than the middle and top, that’s an expansive or “population pyramid” shape → lots of young people → population is growing rapidly (high birth rate, population momentum). If the bars are about the same width through most ages (rectangular), that’s stationary → birth and death rates are roughly balanced → population is stable. If the base is narrower than the middle and top (constrictive), fewer young people → low birth rate → population is declining. Also note helpful clues: very wide reproductive cohorts imply future growth even if current birth rate falls (momentum); a wide post-reproductive group but narrow base signals an aging population and rising dependency ratio. These ideas match the CED EKs on interpreting growth from age-structure diagrams. Want practice? Check the Topic 3.6 study guide (https://library.fiveable.me/ap-environmental-science/unit-3/age-structure-diagrams/study-guide/Dh16VKqnmPyH9TaTfLtY) and AP practice problems (https://library.fiveable.me/practice/ap-environmental-science).
What's the difference between a stable population and a declining population on age structure diagrams?
A stable (stationary) population has roughly equal widths across the age cohorts—pre-reproductive, reproductive, and post-reproductive—so the base (young) and middle (reproductive) age groups are similar in size. That shape means birth rate ≈ replacement-level fertility, low growth rate, and a roughly constant population size over time. A declining (constrictive) population has a narrower base than the middle: fewer young people and a larger proportion in reproductive/post-reproductive cohorts. That indicates low birth rates below replacement, an aging population, negative population growth, higher dependency ratio, and less future population momentum. On the AP exam you’ll be asked to interpret growth from these shapes (EK EIN-1.A.1–1.A.2). For a quick refresher, see the Topic 3.6 study guide (https://library.fiveable.me/ap-environmental-science/unit-3/age-structure-diagrams/study-guide/Dh16VKqnmPyH9TaTfLtY). For more practice, check Unit 3 review (https://library.fiveable.me/ap-environmental-science/unit-3) and practice problems (https://library.fiveable.me/practice/ap-environmental-science).
How do you interpret the shape of age structure diagrams for population growth rates?
Read the shape of an age-structure diagram like a quick diagnosis of population growth: - Expansive (wide base, narrow top): lots of pre-reproductive people → high birth rate, rapidly growing population (high future growth and strong population momentum). - Stationary (rectangular): similar sized cohorts across ages → low birth and death rates, near zero growth (replacement-level fertility). - Constrictive (narrow base): fewer young people → low or negative growth, aging population, higher dependency ratio. Look at cohort widths (pre-reproductive, reproductive, post-reproductive) and sex ratio too. Wide reproductive + wide pre-reproductive → rapid growth now and soon; narrow pre-reproductive but wide older cohorts → declining growth and rising elderly dependency. For AP exam, use these terms (expansive/steady/stationary/constrictive, cohort, dependency ratio, population momentum) and be ready to explain how shape links to fertility, mortality, and life expectancy. Review the Topic 3.6 study guide (https://library.fiveable.me/ap-environmental-science/unit-3/age-structure-diagrams/study-guide/Dh16VKqnmPyH9TaTfLtY) and try practice questions (https://library.fiveable.me/practice/ap-environmental-science).
Why does the shape of the population pyramid matter for predicting future growth?
The shape matters because it shows how many people are in each cohort (pre-reproductive, reproductive, post-reproductive)—and that directly predicts future birth and death patterns (EK EIN-1.A.1, A.2). An expansive/“pyramid” shape (wide base) means lots of young people → high future population growth, high dependency ratio, and strong population momentum even if fertility drops. A stationary shape (roughly rectangular) means replacement-level fertility and stable population. A constrictive shape (narrow base) means fewer young people → shrinking population and aging workforce. Use terms like fertility rate, cohort, life expectancy, and dependency ratio when you explain this on the exam. AP multiple-choice and FRQs often ask you to interpret these shapes and predict growth (Unit 3 content). Review the Topic 3.6 study guide (https://library.fiveable.me/ap-environmental-science/unit-3/age-structure-diagrams/study-guide/Dh16VKqnmPyH9TaTfLtY) and practice problems (https://library.fiveable.me/practice/ap-environmental-science) to get quick question practice.
Can someone explain in simple terms what it means when an age structure diagram looks like an actual pyramid vs when it's more rectangular?
If the age-structure diagram is a pyramid (wide base, narrow top) it means a lot of young people—high birth rate and rapid population growth (expansive or population pyramid). That predicts population momentum: even if fertility falls, lots of pre-reproductive people mean the population will keep growing. A more rectangular shape means similar-sized cohorts across ages (stationary pyramid)—birth and death rates are low and growth is near zero (stable population). A constrictive shape (narrow base) shows fewer young people and likely population decline. Use terms: pre-reproductive, reproductive, post-reproductive cohorts; fertility rate; dependency ratio; life expectancy. On the AP exam, you may be asked to infer growth rate or stage in the demographic transition from these shapes (Topic 3.6, EIN-1.A). For a quick refresher, check the Topic 3.6 study guide (https://library.fiveable.me/ap-environmental-science/unit-3/age-structure-diagrams/study-guide/Dh16VKqnmPyH9TaTfLtY) and try practice questions (https://library.fiveable.me/practice/ap-environmental-science).
What does it mean when there are more people in the younger age groups compared to older age groups?
If an age-structure diagram shows more people in the younger age groups than older ones, it’s an expansive (pyramid) shape and indicates a rapidly growing population. That pattern (EK EIN-1.A.1 & A.2) means high birth rate and a large pre-reproductive cohort, so population momentum will keep numbers rising even if fertility falls. Practical implications: high dependency ratio (lots of young dependents), future demand for schools, jobs, housing, and greater strain on resources and services. On the AP exam you might be asked to identify this shape and explain links to fertility, mortality, and demographic transition stage (often stage 2). For a quick review, see the Topic 3.6 study guide (https://library.fiveable.me/ap-environmental-science/unit-3/age-structure-diagrams/study-guide/Dh16VKqnmPyH9TaTfLtY). For broader Unit 3 review and practice questions head to (https://library.fiveable.me/ap-environmental-science/unit-3) and (https://library.fiveable.me/practice/ap-environmental-science).
I don't understand how demographers use these diagrams to predict population trends - how does that work?
Think of an age-structure diagram as a snapshot of a population’s cohorts (pre-reproductive, reproductive, post-reproductive). Demographers read the shape to predict short- and long-term trends: - Expansive (wide base): lots of young people → high birth rate, rapid population growth now and for decades (population momentum). - Stationary (rectangular): similar widths across cohorts → birth and death rates roughly equal, stable population. - Constrictive (narrow base): fewer young people → low fertility, likely population decline and aging population with higher dependency ratio. You also look for bulges (past baby booms) or dips (wars, epidemics) that shift future age cohorts. For AP exam tasks, use these diagrams to state growth rate predictions, explain causes (fertility, mortality, life expectancy) and give consequences (dependency ratio, resource needs). Want more practice reading examples and exam-style questions? Check the Topic 3.6 study guide (https://library.fiveable.me/ap-environmental-science/unit-3/age-structure-diagrams/study-guide/Dh16VKqnmPyH9TaTfLtY) and Unit 3 resources (https://library.fiveable.me/ap-environmental-science/unit-3).
Why do developed countries usually have different shaped age structure diagrams than developing countries?
Developed and developing countries show different age-structure shapes because of differences in birth rates, death rates, life expectancy, and where they are in the demographic transition. Developing countries usually have high fertility and birth rates and lower life expectancy, so their age-structure is an expansive pyramid—wide base (many pre-reproductive kids), high dependency ratio, and rapid population growth (population momentum). Developed countries tend to have low birth and death rates, higher life expectancy, and often replacement or below-replacement fertility, so their diagrams are constrictive or stationary (narrower base, larger proportion in reproductive and post-reproductive cohorts), indicating stable or declining growth. These shapes tell you growth rate and social challenges (e.g., youth vs. elderly dependency). For APES, you should be able to identify pyramid type (expansive, constrictive, stationary) and link it to fertility, mortality, and demographic transition stage—skills often tested in Unit 3 questions. Review the Topic 3.6 study guide for examples (https://library.fiveable.me/ap-environmental-science/unit-3/age-structure-diagrams/study-guide/Dh16VKqnmPyH9TaTfLtY) and practice problems at (https://library.fiveable.me/practice/ap-environmental-science).
How do birth rates and death rates affect the shape of age structure diagrams?
Birth and death rates change the widths of cohorts (pre-reproductive, reproductive, post-reproductive) and so change the pyramid shape. High birth rate + falling death rate → lots of young people, wide base = expansive pyramid (rapid growth, positive population momentum). Low birth rate + low death rate → roughly equal widths across ages = stationary pyramid (stable population, near replacement-level fertility). Low birth rate + higher proportion of older people → narrow base and bulging top = constrictive pyramid (declining population). Mortality patterns also matter: high child mortality thins the base; high elderly mortality shortens the top. On the AP exam you should be able to identify these shapes and infer growth rate and factors like fertility, life expectancy, and dependency ratio (CED EK EIN-1.A, EIN-1.A.1–2). For quick review, check the Topic 3.6 study guide (https://library.fiveable.me/ap-environmental-science/unit-3/age-structure-diagrams/study-guide/Dh16VKqnmPyH9TaTfLtY) and more unit practice at (https://library.fiveable.me/ap-environmental-science/unit-3) or practice problems (https://library.fiveable.me/practice/ap-environmental-science).
What would happen to a population's age structure diagram after a major war or disease outbreak?
A major war or disease outbreak will show up on an age-structure diagram as a sudden narrowing (indentation) in the cohorts that experienced high mortality. If the war mostly kills young adults (common), the reproductive cohort (roughly ages 15–44) will be noticeably smaller—a “bite” out of the pyramid. A disease that hits infants or the elderly will shrink the pre-reproductive or post-reproductive cohorts instead. That immediate change can reduce birth rates (fewer people in the reproductive cohort), raise the dependency ratio, and slow or reverse population growth over time (population momentum declines). On the AP exam you should describe which cohort is affected (pre-reproductive, reproductive, post-reproductive) and link the shape change to growth rate interpretation per EK EIN-1.A. For a focused review, see the Topic 3.6 study guide (https://library.fiveable.me/ap-environmental-science/unit-3/age-structure-diagrams/study-guide/Dh16VKqnmPyH9TaTfLtY) and more Unit 3 resources (https://library.fiveable.me/ap-environmental-science/unit-3). For extra practice, use Fiveable’s APES practice problems (https://library.fiveable.me/practice/ap-environmental-science).
I'm studying for the AP exam - what are the key things I need to remember about interpreting these population pyramids?
Key things to remember when reading age-structure diagrams (population pyramids): - Look at the three cohorts: pre-reproductive (young), reproductive (middle), post-reproductive (old). The shape tells growth rate: wide base = expansive/rapid growth; straight sides = stationary/stable; narrow base = constrictive/declining (EK EIN-1.A.1–A.2). - Translate shape into drivers: a wide base usually means high birth/fertility rates and population momentum; a narrow base suggests low fertility, higher life expectancy, and aging population. - Use dependency ratio and sex ratio to infer social/economic impacts: more young or old dependents → higher dependency burden. - Watch for abrupt changes (war, disease, migration) that distort cohorts. - For the AP exam, be ready to explain how a pyramid’s shape links to birth rate, mortality, life expectancy, replacement-level fertility, and demographic transition stage. Review the Topic 3.6 study guide for quick practice (https://library.fiveable.me/ap-environmental-science/unit-3/age-structure-diagrams/study-guide/Dh16VKqnmPyH9TaTfLtY) and more Unit 3 resources (https://library.fiveable.me/ap-environmental-science/unit-3).
Why is the proportion of young people so important for determining if a population will keep growing?
The proportion of young people (the pre-reproductive cohort) tells you how many future breeders are already in the pipeline. Even if current birth rates drop to replacement level, a population with a large base of young people will keep growing for several decades because those kids will enter reproductive age—that’s population momentum. Age-structure diagrams show this: an expansive pyramid (wide base) predicts rapid growth, a stationary pyramid predicts stable size, and a constrictive pyramid predicts decline (CED EK EIN-1.A.1–A.2). For the AP exam, you should be able to read a pyramid’s shape, identify cohorts (pre-reproductive, reproductive, post-reproductive), and explain how fertility and momentum affect future growth. Want practice interpreting diagrams? Check the Topic 3.6 study guide (https://library.fiveable.me/ap-environmental-science/unit-3/age-structure-diagrams/study-guide/Dh16VKqnmPyH9TaTfLtY) and more practice problems (https://library.fiveable.me/practice/ap-environmental-science).
How do age structure diagrams help scientists predict future population size and growth patterns?
Age-structure diagrams show the percent (or number) of people in pre-reproductive, reproductive, and post-reproductive cohorts by age and sex. From the shape you can predict growth: an expansive (wide base) pyramid means lots of young people → high future population growth and strong population momentum; a stationary pyramid (even widths) means near-zero growth; a constrictive shape (narrow base) signals declining population. You can also infer fertility and mortality trends (high birth rate, lower life expectancy) and calculate dependency ratios (young + old dependents per working-age person), which affect economy and resource demand. On the AP exam, interpret diagrams by citing cohort proportions, shape, and terms like replacement-level fertility and population momentum (Topic 3.6, EK EIN-1.A.1–2). For a clear refresher and practice, see the Topic 3.6 study guide (https://library.fiveable.me/ap-environmental-science/unit-3/age-structure-diagrams/study-guide/Dh16VKqnmPyH9TaTfLtY) and more unit practice (https://library.fiveable.me/practice/ap-environmental-science).