🏭Intro to Industrial Engineering Unit 3 Review
3.3 Applications in Service and Manufacturing Industries
3.3 Applications in Service and Manufacturing Industries
Unit & Topic Study Guides
Industrial Engineering: Systems Optimization
Operations Research & Linear Programming
Queuing Theory: Principles and Applications
Inventory Management Fundamentals
Production Planning & Scheduling
Facility Layout & Material Handling
Quality Control and Six Sigma
Ergonomics & Workplace Design
Supply Chain and Logistics Management
Simulation Modeling & Analysis
Project Management for Engineers
Engineering Economics & Cost Analysis
Lean Manufacturing & Continuous Improvement
Automation and Industrial Robotics
Queuing Theory Applications
Queuing theory gives you a mathematical framework for analyzing waiting lines. Whether it's patients in an ER or parts on an assembly line, these models help you predict how long things wait, how busy servers get, and where bottlenecks form. That makes it one of the most practical tools in industrial engineering for balancing cost against performance.
Mathematical Foundations and Performance Metrics
Every queuing system has the same basic structure: things arrive, they wait (maybe), they get served, and they leave. Queuing theory lets you model each piece mathematically so you can predict system behavior before making expensive changes.
Core performance metrics you'll need to know:
- Average wait time — how long a customer or item spends waiting before service begins
- Queue length — the average number of items waiting in line at any given moment
- Server utilization — the fraction of time servers are actually busy (typically expressed as a percentage)
- System throughput — the rate at which items complete service and exit the system
Classifying queuing models. Models are categorized by four characteristics:
- Arrival process — how items show up (e.g., Poisson arrivals, scheduled arrivals)
- Service time distribution — how long service takes (e.g., exponential, deterministic)
- Number of servers — single-server vs. multi-server systems
- Queue discipline — the rule for who gets served next (FIFO, LIFO, or priority-based)
Little's Law is one of the most important relationships in queuing theory. It states:
where is the average number of items in the system, is the average arrival rate, and is the average time an item spends in the system. This holds for any stable queuing system regardless of the arrival pattern or service distribution, which makes it remarkably useful.
When systems get too complex for closed-form equations (multiple product types, variable routing, etc.), simulation and multi-server models fill the gap. Discrete event simulation in particular lets you model real-world messiness that analytical formulas can't capture.
Industry Applications and Capacity Planning
Service industry applications focus on managing the customer experience:
- Banks and retail stores — determining how many tellers or registers to open so wait times stay acceptable
- Restaurants — scheduling staff across shifts to match demand patterns (lunch rush vs. mid-afternoon lull)
- Facility design — laying out physical spaces so customer flow doesn't create unnecessary congestion
Manufacturing applications focus on throughput and cost:
- Production line optimization — identifying which workstation is the bottleneck and deciding where to add capacity
- Inventory management — modeling how buffer stock between stations prevents starvation and blocking
- Supply chain logistics — analyzing loading docks, shipping queues, and warehouse operations to improve flow
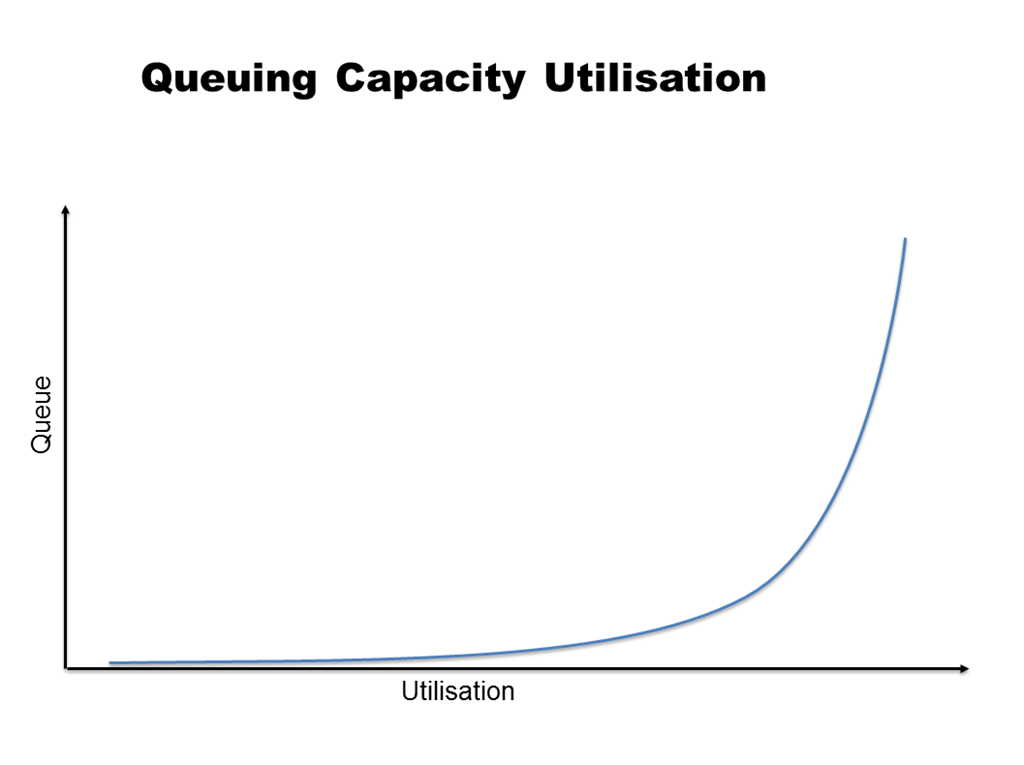
Capacity planning uses queuing models to answer a specific question: how many servers or workstations do you need? Add too few, and wait times explode. Add too many, and you're paying for idle resources. Queuing formulas let you find the point where service targets are met at minimum cost.
Queuing networks extend single-queue models to systems with multiple interconnected queues. Think of an airport: passengers move from check-in to security to the gate, each with its own queue. Theme parks work the same way. Modeling these as networks lets you find the weakest link in the chain.
Queuing Problems in Service Systems

Call Center Management
Call centers are a textbook application of queuing theory because the system maps cleanly onto the models: calls arrive randomly, agents serve them, and callers wait in a queue if no agent is free.
The main challenges are:
- Routing calls to the right agent (skill-based routing adds complexity)
- Minimizing wait times to keep customers from hanging up
- Maximizing agent utilization so you're not overstaffed
Erlang models are the standard tool here. The Erlang-C model, for example, predicts the probability that a caller has to wait and the expected wait time, given a known call arrival rate and average handle time. Managers use these outputs to set staffing levels that hit a target service level (e.g., "80% of calls answered within 20 seconds").
Performance analysis also tracks the abandonment rate, which is the percentage of callers who hang up before reaching an agent. High abandonment signals that staffing is too low or handle times are too long.
Healthcare System Optimization
Hospitals contain several distinct queuing systems, each with different characteristics:
- Emergency rooms — unpredictable arrivals, highly variable service times, life-or-death stakes
- Operating theaters — scheduled arrivals but frequent delays and cancellations
- Outpatient clinics — appointment-based but subject to no-shows and walk-ins
Triage is a real-world example of priority queuing. Patients aren't served in the order they arrive. Instead, they're classified by severity, and critical cases jump ahead. This improves outcomes for the sickest patients, but it means lower-priority patients can face very long waits.
Appointment scheduling is its own optimization problem. If you schedule patients too tightly, a single long appointment creates a cascade of delays. If you leave too much slack, providers sit idle. Advanced queuing models account for no-show probabilities and service time variability to find schedules that minimize both patient waiting and provider downtime.
Optimization with Queuing Models
Production Line Performance
Manufacturing lines are often modeled as tandem queues, where items move from one workstation to the next in a fixed sequence. Each station is its own queue, and the slowest station determines the maximum throughput of the entire line.
Queuing models help you:
- Identify bottlenecks — find the station with the highest utilization rate, since that's what limits your throughput
- Optimize buffer sizes — determine how much work-in-process inventory to allow between stations (too little causes blocking and starvation; too much ties up capital)
- Set the right number of workstations — decide whether adding a parallel station at the bottleneck is worth the investment
Capacity analysis uses these models to calculate the maximum sustainable throughput of a production system. If demand is projected to grow, you can identify exactly where the system will fail first and invest accordingly.
Resource Allocation and Variability Management
Resource allocation in manufacturing means balancing competing goals:
- Machine utilization — you want machines running, not sitting idle
- Work-in-process (WIP) inventory — you want enough to keep stations fed, but not so much that it clogs the floor
- Production targets — you need to meet demand
- Operational costs — labor, energy, and maintenance all factor in
Variability is the enemy of queuing performance. Even small increases in the variability of processing times or arrival rates can cause disproportionate increases in wait times and queue lengths. This is why queuing models are so valuable: they quantify the cost of variability and help you decide where to invest in reducing it.
When analytical models can't capture the full complexity of a system (multiple product types, flexible routing, machine breakdowns), discrete event simulation steps in. Simulation lets you build a virtual model of the system, run thousands of scenarios, and test changes before implementing them on the real floor.
Customer Satisfaction vs. System Efficiency
Metrics and Trade-offs
These two goals are in constant tension. Customer satisfaction depends on short wait times, while system efficiency depends on keeping servers busy, which requires some queue to exist.
Customer satisfaction metrics:
- Average wait time
- Probability of waiting beyond a threshold (e.g., more than 5 minutes)
- Perceived fairness of the queuing discipline
System efficiency metrics:
- Server/resource utilization
- Throughput
- Total operational cost
One critical insight: the relationship between wait time and satisfaction is non-linear. A customer who waits 2 minutes instead of 1 barely notices. But a customer who waits 15 minutes instead of 10 is significantly more frustrated. Satisfaction drops sharply once waits exceed what customers consider reasonable.
Adding servers (more cashiers, more agents, more machines) improves satisfaction but creates a cost trade-off. During peak hours, extra capacity pays for itself. During off-peak periods, those same servers sit underutilized. This is why variable staffing and flexible capacity matter.
Optimization Strategies
Beyond adding raw capacity, several strategies can improve the balance:
- Providing wait time estimates — customers tolerate waits better when they know how long it'll be
- Offering distractions during the wait — music, screens, or browsing areas reduce perceived wait time even when actual wait time stays the same
- Priority queuing — routing urgent cases ahead (ER triage, premium customers) improves outcomes for high-value interactions
- Express lanes — dedicating servers to quick transactions keeps simple cases from getting stuck behind complex ones
Priority queuing and express lanes do carry a risk: customers in the regular queue may perceive the system as unfair, which hurts satisfaction even if overall system performance improves.
The right balance depends on your specific context. A luxury hotel and a fast-food restaurant have very different tolerance levels for wait times, and the cost of a lost customer varies enormously across industries. Queuing models give you the numbers; the business context tells you where to set the target.