🏭Intro to Industrial Engineering Unit 15 Review
15.4 Decision Analysis and Multi-Criteria Decision Making
15.4 Decision Analysis and Multi-Criteria Decision Making
Unit & Topic Study Guides
Industrial Engineering: Systems Optimization
Operations Research & Linear Programming
Queuing Theory: Principles and Applications
Inventory Management Fundamentals
Production Planning & Scheduling
Facility Layout & Material Handling
Quality Control and Six Sigma
Ergonomics & Workplace Design
Supply Chain and Logistics Management
Simulation Modeling & Analysis
Project Management for Engineers
Engineering Economics & Cost Analysis
Lean Manufacturing & Continuous Improvement
Automation and Industrial Robotics
Decision problems in industrial engineering
Decision Analysis and Multi-Criteria Decision Making give industrial engineers a structured way to choose among competing alternatives when multiple factors are at play. Instead of relying on gut feeling, these methods break complex problems into parts, weigh trade-offs, and account for uncertainty, leading to more defensible and transparent decisions.
Problem formulation and analysis
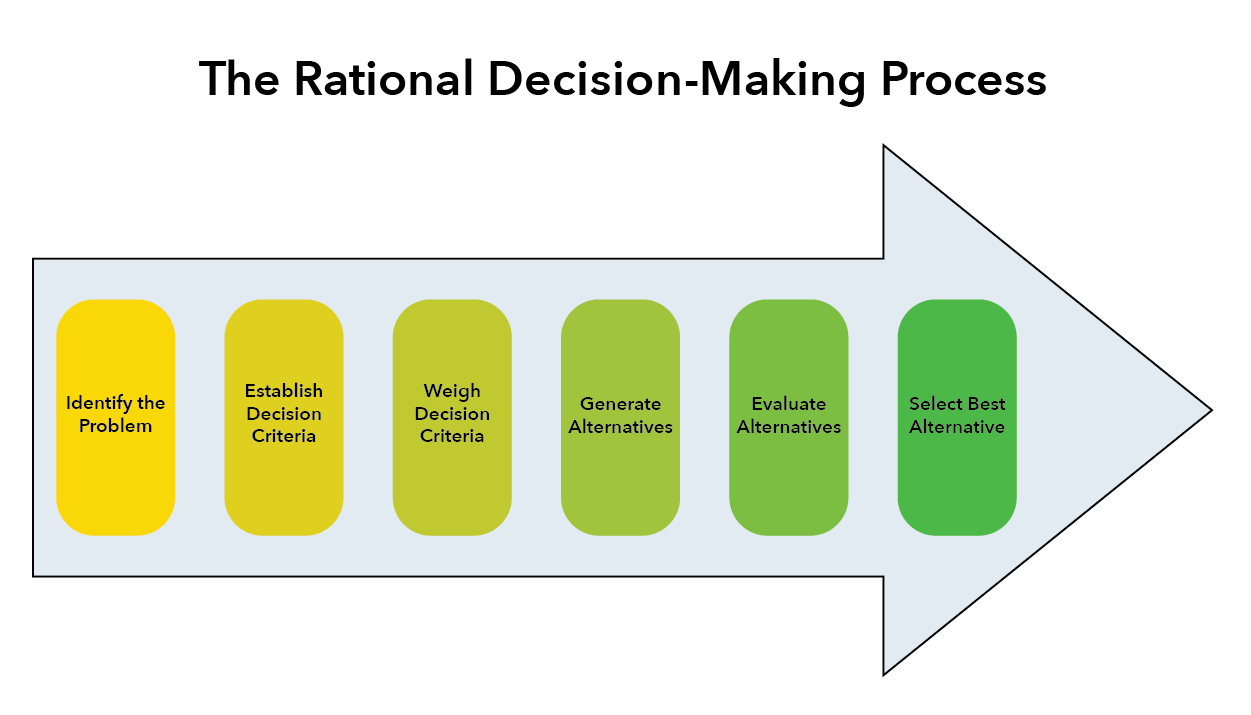
Every decision problem starts with the same core question: which course of action is best, given what we know and what we care about? Formulating the problem well is half the battle.
A typical decision analysis process follows these steps:
- Define the problem clearly, including what outcome you're trying to achieve.
- Identify alternatives — the different solutions or actions you could take (e.g., upgrading equipment, redesigning a workflow, or adopting new technology).
- Determine criteria — the factors you'll use to judge each alternative. Common criteria in industrial engineering include cost, quality, time, efficiency, safety, and environmental impact.
- Evaluate options — score or rank each alternative against the criteria.
Stakeholder analysis is an important early step. Different parties (operators, managers, customers, regulators) often prioritize criteria differently. Identifying these perspectives up front prevents blind spots.
The Analytic Hierarchy Process (AHP) is one popular way to structure a complex decision. It organizes criteria into a hierarchy of main criteria and sub-criteria, then uses pairwise comparisons to determine how much each criterion matters relative to the others. This keeps the process consistent and transparent, even when many factors are involved.
Constraints and feasibility
Constraints narrow down which alternatives are actually possible. You need to define them clearly before evaluating options, or you risk recommending a solution that can't be implemented.
Common types of constraints in industrial engineering:
- Resource constraints — budget limits, available labor, raw materials
- Technical constraints — equipment capabilities, technological limitations
- Regulatory constraints — safety standards, environmental regulations
- Time constraints — project deadlines, production schedules
Feasibility analysis checks whether each proposed alternative satisfies all defined constraints. An alternative that violates a hard constraint gets eliminated, no matter how well it scores on other criteria.
Trade-off analysis comes into play when objectives conflict with each other. For example, increasing production speed might reduce quality control effectiveness. Understanding these trade-offs helps you find solutions that balance competing goals rather than optimizing one at the expense of another.
Decision tree analysis for uncertainty
Decision trees are a visual tool for mapping out decisions that unfold over time, especially when uncertainty is involved. They make it easier to see the structure of a problem and calculate which path gives the best expected outcome.

Structure and components
A decision tree has three types of nodes:
- Decision nodes (drawn as squares) — points where you choose between alternatives
- Chance nodes (drawn as circles) — points where an uncertain event occurs, with multiple possible outcomes
- End nodes (drawn as triangles) — final outcomes, each with an associated payoff value
Branches coming out of a chance node each carry a probability representing how likely that outcome is. The probabilities from any single chance node must sum to 1. Each end node has a payoff that quantifies the value (usually in dollars) of reaching that outcome.
Analysis techniques
Expected Monetary Value (EMV) is the most common way to evaluate a decision tree. You calculate it by multiplying each outcome's probability by its payoff, then summing:
For example, suppose launching a new product has a 60% chance of earning and a 40% chance of losing :
The rollback procedure solves a decision tree by working backwards from the end nodes toward the initial decision:
- At each chance node, calculate the EMV.
- At each decision node, pick the branch with the highest EMV.
- Continue until you reach the root of the tree. The path you've traced is the optimal decision strategy.
Risk attitudes matter here. A risk-averse decision maker might avoid a high-EMV option if it carries a chance of a large loss. Utility functions can be used to adjust raw payoffs so they reflect the decision maker's tolerance for risk.
Sensitivity analysis on a decision tree involves changing probabilities or payoffs to see whether the optimal decision changes. This helps you identify which uncertainties matter most and whether your chosen path is robust.
Multi-criteria decision making
When a decision involves multiple conflicting objectives that are measured in different units (dollars vs. hours vs. defect rates), you need Multi-Criteria Decision Making (MCDM) methods. These techniques provide a structured way to combine different types of criteria into an overall evaluation.
Basic MCDM techniques
Weighted Sum Model (WSM) is the simplest approach. You assign a weight to each criterion (reflecting its importance), score each alternative on each criterion, then compute a weighted total:
where is the weight of criterion and is the score of alternative on criterion . The alternative with the highest total score wins.
For example, if you're selecting a warehouse location based on cost (weight 0.5), accessibility (weight 0.3), and size (weight 0.2), you'd score each candidate location on all three criteria, multiply by the weights, and sum.
WSM is intuitive but has a key limitation: all criteria scores must be in comparable units (or normalized first).
Analytic Hierarchy Process (AHP) handles more complex decisions. It uses pairwise comparisons ("Is cost more important than accessibility? By how much?") to derive criteria weights mathematically. AHP also includes a consistency ratio check — if your pairwise judgments contradict each other too much, the method flags it so you can revise.
Advanced MCDM methods
These methods handle more nuanced situations:
- TOPSIS (Technique for Order Preference by Similarity to Ideal Solution) — Defines a theoretical best (positive ideal) and worst (negative ideal) alternative, then ranks real alternatives by how close they are to the best and how far from the worst. It uses geometric distance, so it captures trade-offs well.
- PROMETHEE (Preference Ranking Organization Method for Enrichment Evaluations) — Compares alternatives pairwise on each criterion using preference functions. This allows you to define how much of a difference between two alternatives actually matters, which is more realistic than treating every small gap as meaningful.
- Goal programming — Used when you have specific target values for each objective. Instead of maximizing or minimizing, you minimize the total deviation from your goals. This is useful when "good enough on everything" matters more than "best on one thing."
- Fuzzy MCDM methods — Incorporate fuzzy set theory to handle vague or imprecise inputs (e.g., when criteria scores are described as "approximately 7 out of 10" rather than exact numbers). These methods are helpful when real-world data is uncertain or subjective.
Sensitivity analysis for robustness
A decision is only as good as the inputs behind it. Sensitivity analysis tests whether your conclusion holds up when those inputs change, helping you understand how confident you should be in your recommendation.
Types of sensitivity analysis
One-way sensitivity analysis varies a single parameter while holding everything else constant. This is the simplest form and tells you which individual inputs have the most influence. For example, you might test how the choice of manufacturing process changes as material cost increases from to per unit.
Two-way sensitivity analysis changes two parameters simultaneously. This is useful when you suspect two variables interact — for instance, both material cost and demand volume might shift together during an economic downturn.
Monte Carlo simulation is used for probabilistic sensitivity analysis. Instead of testing a few specific values, you assign probability distributions to uncertain inputs and run thousands of simulations. The result is a distribution of possible outcomes, giving you a much richer picture of risk.
Interpretation and visualization
Tornado diagrams display the results of one-way sensitivity analysis as horizontal bars, ordered from most to least impactful parameter. The widest bar at the top represents the variable that swings the outcome the most. These diagrams quickly show you where to focus your attention.
Threshold values are the specific points where a parameter change causes the optimal decision to flip. If your preferred alternative stays best unless material costs exceed per unit, that figure is the threshold. Knowing this helps you monitor the right variables.
Robust decision making takes sensitivity analysis a step further. Rather than picking the single best-performing option under expected conditions, it looks for alternatives that perform reasonably well across a wide range of scenarios. This approach prioritizes flexibility and resilience.
Sensitivity analysis results should guide three practical actions:
- Data collection — Invest effort in getting better estimates for the parameters that matter most.
- Risk mitigation — Develop strategies to manage the uncertainties that most affect your decision.
- Contingency planning — Prepare backup plans for scenarios where the optimal decision shifts.