🎲Intro to Statistics Unit 9 Review
9.3 Probability Distribution Needed for Hypothesis Testing
9.3 Probability Distribution Needed for Hypothesis Testing
Unit & Topic Study Guides
Sampling and Data
Descriptive Statistics
Probability Topics
Discrete Random Variables
Continuous Random Variables
The Normal Distribution
The Central Limit Theorem
Confidence Intervals
Hypothesis Testing: Single Sample
Two-Sample Hypothesis Testing
Chi-Square Distribution
Linear Regression and Correlation
Probability Distributions for Hypothesis Testing
Probability distributions for hypothesis tests
Each hypothesis test relies on a specific probability distribution to determine whether your sample data provides enough evidence against the null hypothesis. Choosing the wrong distribution will give you the wrong p-value, so matching your situation to the right distribution matters.
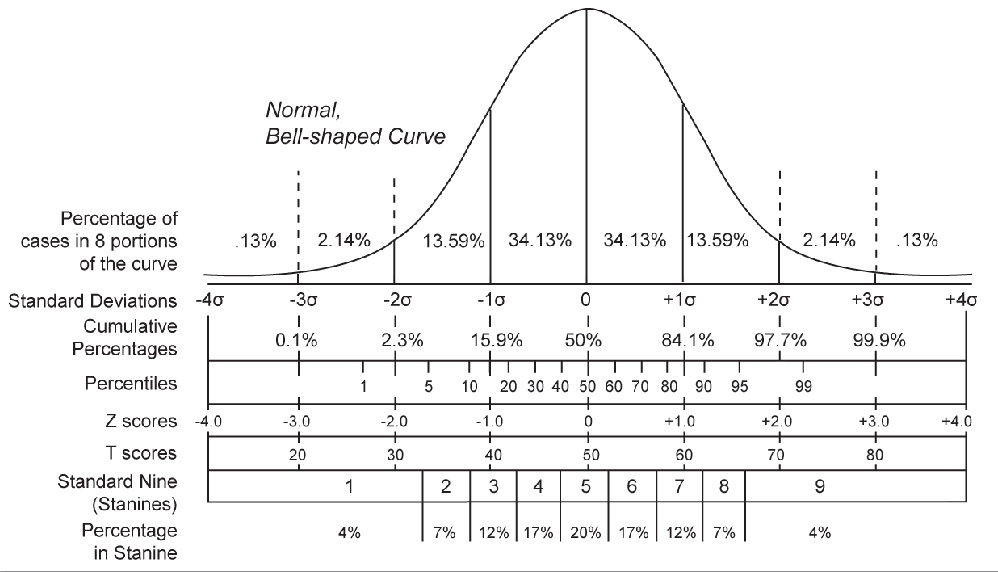
- Normal distribution (z-distribution)
- Used to test population means when the population standard deviation is known or the sample size is large ()
- Also used to test population proportions when the sample is large enough to satisfy normal approximation conditions (covered below)
- Student's t-distribution
- Used to test population means when the population standard deviation is unknown and the sample size is small (). You estimate the population standard deviation using the sample standard deviation, which introduces extra uncertainty. The t-distribution accounts for that by having heavier tails than the normal distribution.
- As sample size grows, the t-distribution looks more and more like the normal distribution.
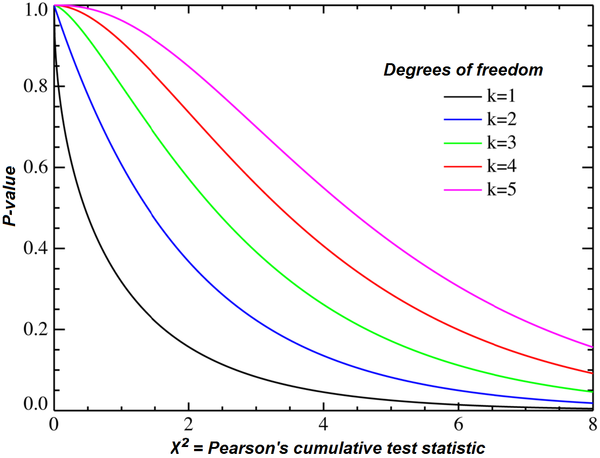
- Chi-square distribution
- Used for goodness-of-fit tests, tests of independence, and tests of homogeneity
- F-distribution
- Used to compare two or more population variances (F-test) and to assess overall significance in regression analysis (ANOVA)
- Binomial distribution
- Used to test population proportions when the sample size is too small to meet the normal approximation conditions
Key assumptions of distribution tests
Every distribution comes with assumptions. If those assumptions aren't met, your test results can be unreliable.
- Normal distribution assumptions
- The data follows a normal distribution, or the sample size is large enough () for the Central Limit Theorem to kick in
- Observations are independent of each other
- The population standard deviation is known
- Student's t-distribution assumptions
- The data follows a normal distribution, or the sample size is large enough () for the Central Limit Theorem to apply
- Observations are independent of each other
- The population standard deviation is unknown (this is the key difference from the z-test)
- Binomial distribution assumptions
- Trials are independent of each other
- Each trial has exactly two outcomes (success or failure)
- The probability of success stays constant across all trials
- The number of trials is fixed
Normal approximation in proportion tests
When testing a population proportion, you can use the normal distribution (z-test) instead of the binomial distribution, but only if the sample is large enough. Here's how to check:
- Independence: The sample must be a simple random sample from the population.
- Sample size: Both of these conditions must hold:
- where is the sample size and is the hypothesized population proportion.
For example, if you're testing whether a coin is fair () with flips, you'd check: and . Both pass, so the normal approximation works here.
If both conditions are met, the sampling distribution of the sample proportion is approximately normal with:
- Mean:
- Standard deviation:
If either condition fails, you'd need to use the binomial distribution directly.
Hypothesis Testing Framework
These terms come up in every hypothesis test, regardless of which distribution you use.
- Null hypothesis (): The default assumption about a population parameter (e.g., "the population mean equals 50"). You assume it's true unless the data convinces you otherwise.
- Alternative hypothesis (): The claim you're testing against the null. It can be one-sided ( or ) or two-sided ().
- Significance level (): A threshold you set before collecting data, typically 0.05. If your p-value falls below , you reject the null hypothesis.
- P-value: The probability of getting a test statistic at least as extreme as the one you observed, assuming the null hypothesis is true. A small p-value means your data is unlikely under .
- Type I error: Rejecting the null hypothesis when it's actually true. The probability of a Type I error equals .
- Confidence interval: A range of values likely to contain the true population parameter. If a hypothesized value falls outside the confidence interval, that's consistent with rejecting at the corresponding significance level.