🎲Intro to Statistics Unit 10 Review
10.1 Two Population Means with Unknown Standard Deviations
10.1 Two Population Means with Unknown Standard Deviations
Unit & Topic Study Guides
Sampling and Data
Descriptive Statistics
Probability Topics
Discrete Random Variables
Continuous Random Variables
The Normal Distribution
The Central Limit Theorem
Confidence Intervals
Hypothesis Testing: Single Sample
Two-Sample Hypothesis Testing
Chi-Square Distribution
Linear Regression and Correlation
Comparing Two Population Means with Unknown Standard Deviations
When you want to compare the averages of two groups, you need a method that accounts for the fact that you almost never know the true population standard deviations. The two-sample t-test handles this by estimating variability from the sample data itself, using the Student's t-distribution instead of the normal distribution.
The t-score tells you whether the difference between two group averages is statistically significant or likely due to chance. Cohen's d then tells you how big that difference is in practical terms. Together, they give you both the statistical evidence and the real-world meaning.
T-Score Calculation for Two Population Means
The two-sample t-test compares two population means when the population standard deviations are unknown. Because you're estimating those standard deviations from your samples, the test statistic follows a Student's t-distribution rather than a normal distribution.
The formula is:
where:
- and are the sample means (e.g., average test scores for each class)
- and are the sample variances (how spread out scores are within each class)
- and are the sample sizes (number of observations in each group)
The numerator captures the observed difference between the two sample means. The denominator is the standard error of the difference, which measures how much that difference would vary across repeated samples. A larger t-score means the observed difference is large relative to sampling variability.
Setting up hypotheses:
- Null hypothesis (): The population means are equal, so
- Alternative hypothesis (): Can be two-sided () or one-sided ( or ), depending on your research question
Once you calculate the t-score, you find the p-value using the t-distribution with the appropriate degrees of freedom. If the p-value is less than your significance level (commonly 0.05), you reject .

Degrees of Freedom in T-Distributions
When the two populations may have unequal variances, you use the Welch-Satterthwaite equation to calculate degrees of freedom:
This formula usually produces a non-integer, so you round down to the nearest whole number. For example, if you calculate , you use .
Why does this matter? The degrees of freedom control the shape of the t-distribution. Lower df means heavier tails (more uncertainty), which makes it harder to reach significance. As df increases past about 30, the t-distribution closely resembles the standard normal distribution.
You don't need to memorize this formula for most exams, but you should understand that Welch's approach is preferred over the simpler "pooled" df when you can't assume equal variances between groups.
Cohen's d for Effect Size
Statistical significance (the p-value) tells you whether a difference likely exists, but it doesn't tell you whether that difference is meaningful. A huge sample size can make a tiny, unimportant difference statistically significant. That's where Cohen's d comes in.
Cohen's d measures the size of the difference between two means in standard deviation units:
The pooled standard deviation combines the variability from both groups:
Interpreting Cohen's d:
| Value | Effect Size | What It Means | |---|---|---| | 0.2 | Small | The groups differ, but not by much | | 0.5 | Medium | A noticeable, moderate difference | | 0.8 | Large | A substantial, clearly meaningful difference |
For example, if two classes have average test scores of 78 and 74 with a pooled standard deviation of 8, then , a medium effect. The groups differ by half a standard deviation.
Note: Cohen's d uses the pooled standard deviation, which assumes roughly equal variances. This is a different assumption than the Welch t-test itself, so keep that distinction in mind.
Statistical Inference and Error Types
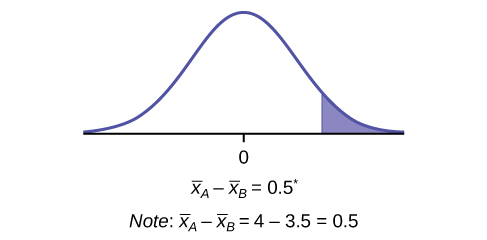
After running your test, a confidence interval for gives you a range of plausible values for the true difference. If the interval doesn't contain zero, that's consistent with rejecting .
Two types of errors can occur in hypothesis testing:
- Type I error (false positive): You reject when it's actually true. You conclude there's a difference when there isn't one. The probability of this equals your significance level .
- Type II error (false negative): You fail to reject when it's actually false. You miss a real difference. The probability of this is denoted .
Statistical power is , the probability of correctly detecting a real difference. Power increases when:
- Sample sizes are larger (less sampling variability)
- The true effect size is larger (easier to detect)
- You use a higher significance level (though this also raises Type I error risk)
In practice, you want enough power (typically 0.80 or higher) to be confident that your study can detect a meaningful difference if one exists.