🎲Intro to Statistics Unit 12 Review
12.5 Prediction
12.5 Prediction
Unit & Topic Study Guides
Sampling and Data
Descriptive Statistics
Probability Topics
Discrete Random Variables
Continuous Random Variables
The Normal Distribution
The Central Limit Theorem
Confidence Intervals
Hypothesis Testing: Single Sample
Two-Sample Hypothesis Testing
Chi-Square Distribution
Linear Regression and Correlation
Prediction Using Least-Squares Regression
Least-squares regression lets you use a linear equation to predict one variable from another. For example, you could predict a student's final exam score based on their midterm score or hours studied. The key is knowing when these predictions are trustworthy and how to interpret them correctly.
Least-Squares Regression for Predictions
The regression line takes the form:
Each piece of this equation has a specific meaning:
- is the predicted value of the response variable (the "hat" symbol tells you it's a prediction, not an observed value)
- is the y-intercept, the predicted value of when
- is the slope, the predicted change in for every one-unit increase in
- is the value of the explanatory variable you're plugging in
To make a prediction, substitute your value into the equation and solve. If your regression equation is and a student scored 80 on the midterm, the predicted final exam score is .

Interpretation of Predicted Values
The predicted value represents the average outcome you'd expect for a given . A student with an 80 on the midterm isn't guaranteed an 82 on the final. That's just the best estimate based on the overall pattern in the data.
Interpreting the y-intercept (): This is the predicted response when . Sometimes this makes sense, and sometimes it doesn't. If is "hours studied," then would be the predicted score for someone who studied zero hours, which is at least plausible. But if is midterm score, a midterm score of zero is so far outside typical data that the intercept has no practical meaning. Always ask yourself: does fall within the range of the data?
Interpreting the slope (): The slope tells you the direction and rate of the relationship. If and the explanatory variable is hours studied, then for each additional hour studied, the predicted exam score increases by 2 points. Ten more hours would correspond to a predicted increase of 20 points.
Appropriate Use of Regression Equations
Not every prediction from a regression equation is a good one. Here are the main things to watch for:
Stay within the data range. Only use the equation to predict for values within (or very close to) the range of your original data. Predicting outside that range is called extrapolation, and it's risky because you have no evidence the linear pattern continues. If your data covers students who studied 1 to 15 hours, predicting for someone who studied 50 hours is extrapolation.
Verify the relationship is actually linear. The regression equation assumes a straight-line relationship. If the scatter plot shows a curve, a linear model will give inaccurate predictions no matter how carefully you calculate.
Check the model assumptions. Before trusting predictions, verify these four conditions (sometimes remembered as LINE):
- Linearity of the relationship
- Independence of observations
- Normality of residuals
- Equal variance of residuals (residuals spread evenly across all values)
If any of these are seriously violated, the predictions may be unreliable.
Consider the strength of the correlation. The correlation coefficient (and the coefficient of determination ) tell you how closely the data follow the linear pattern. A weak correlation (low ) means the model doesn't explain much of the variation in , so predictions will be imprecise.
Watch for influential outliers. A single extreme point can pull the regression line toward it, shifting both the slope and intercept. This can distort predictions for everyone else in the dataset.
Visualizing and Assessing Predictions
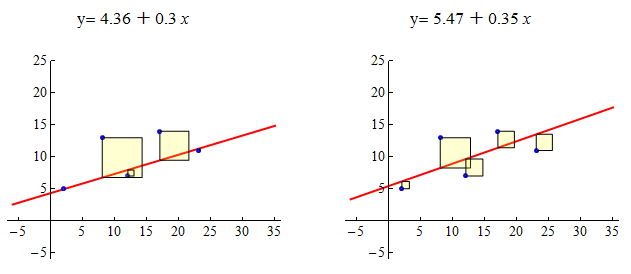
Always start by looking at a scatter plot. It shows you whether the relationship looks linear, whether there are outliers, and whether the spread of points is roughly even across the range of .
The standard error of the estimate (sometimes written ) measures the typical distance between observed values and the regression line. A smaller standard error means your predictions tend to land closer to the actual values.
You can also build prediction intervals around a specific predicted value. These give a range of plausible values for an individual observation at a given . Prediction intervals are wider than confidence intervals for the mean response because individual outcomes vary more than averages do.