
🔟Elementary Algebra Unit 4 Review
4.7 Graphs of Linear Inequalities
4.7 Graphs of Linear Inequalities
Unit & Topic Study Guides
Foundations
Linear Equations and Inequalities
Math Models
Graphs
Systems of Linear Equations
Polynomials
Factoring
Rational Expressions and Equations
Roots and Radicals
Graphing Linear Inequalities
Linear inequalities expand on linear equations, showing regions of solutions instead of single lines. They're useful for understanding real-world scenarios with ranges of acceptable values, like budgets or production limits.
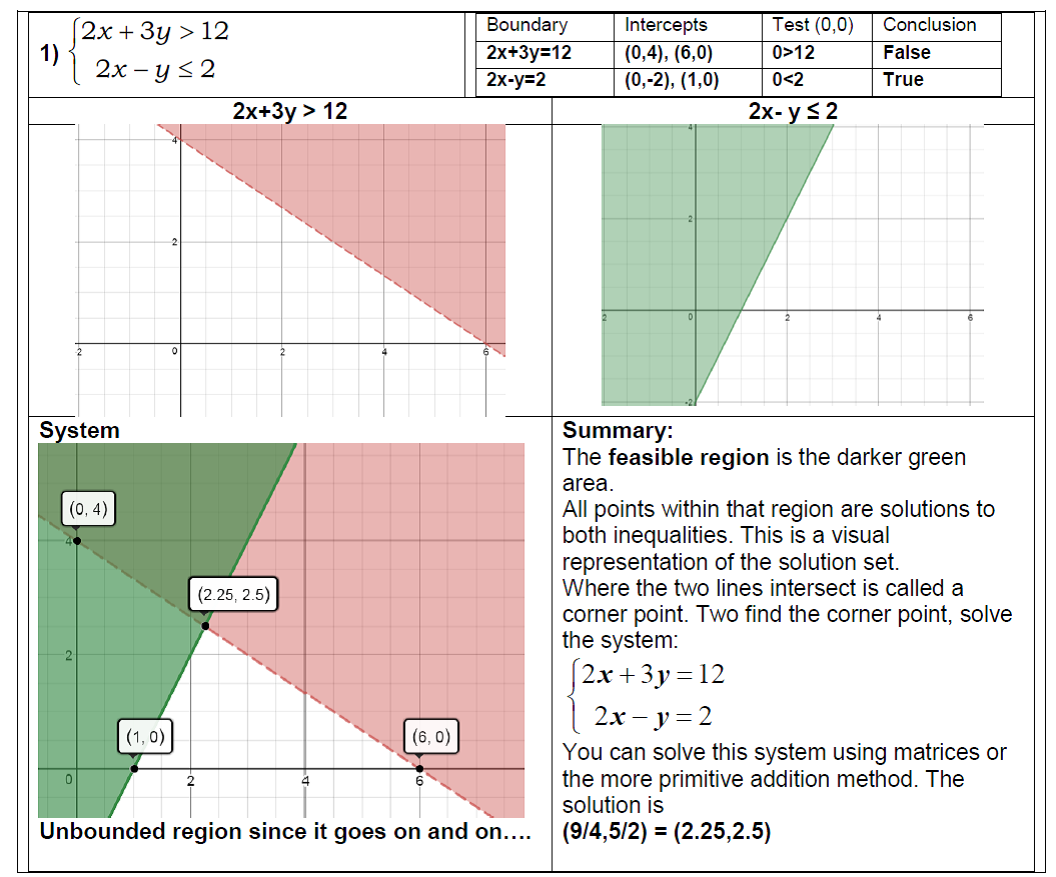
Graphing these inequalities involves plotting a boundary line and shading the correct side. The inequality symbol determines which side to shade and whether the line is solid or dashed.
Graphing Linear Inequalities
How to graph a linear inequality
Here's the process, step by step:
-
Rewrite in slope-intercept form. Get the inequality into the form , , , or . This makes it easy to identify the slope and y-intercept for graphing.
-
Draw the boundary line using the slope () and y-intercept (), just like you would for a regular linear equation.
- Use a dashed line for strict inequalities ( or ). The dashed line means points on the line are not included in the solution.
- Use a solid line for inclusive inequalities ( or ). The solid line means points on the line are included.
-
Shade the correct side of the boundary line:
- Shade below the line for or
- Shade above the line for or
"Above" and "below" refer to the standard orientation when the inequality is solved for . If you're unsure, use a test point (covered below) to confirm.

Solution sets in inequality graphs
Unlike a linear equation where solutions lie on the line, a linear inequality's solutions fill an entire region. The shaded region represents the solution set, meaning every point in that region makes the inequality true.
- Any point in the shaded region satisfies the inequality when you substitute its coordinates for and .
- Points on the boundary line are solutions only if the inequality is inclusive ( or ).
- For : the point sits on the boundary line since . Because the symbol is , this point is a solution.
- Points on the boundary line are not solutions if the inequality is strict ( or ).
- For : that same point is not a solution, because is not strictly less than .
Testing points to verify your shading
If you're ever unsure which side to shade, the test point method gives you a definite answer.
-
Pick a test point that is clearly not on the boundary line. The origin is the easiest choice because it simplifies the arithmetic. (If the boundary line passes through the origin, pick a different point like .)
-
Substitute the test point's coordinates into the original inequality.
-
Evaluate:
- If the inequality comes out true, shade the side that contains the test point.
- If the inequality comes out false, shade the opposite side.
For example, take . Plugging in : is ? That gives , which is true. So you shade the side of the line that contains .
Now take . Plugging in : is ? That gives , which is false. So you shade the side that does not contain .
Tools and concepts for graphing linear inequalities
- The coordinate plane is where you'll visualize the boundary line and shaded solution region.
- A graphing calculator can plot linear inequalities quickly, which is helpful for checking your work.
- You need a solid understanding of linear functions (slope, y-intercept, graphing lines) before tackling inequalities, since the boundary line is just the corresponding linear equation.