📏Honors Pre-Calculus Unit 2 Review
2.2 Graphs of Linear Functions
2.2 Graphs of Linear Functions
Unit & Topic Study Guides
Functions
Linear Functions
Polynomial and Rational Functions
Exponential and Logarithmic Functions
Trigonometric Functions
Periodic Functions
Trig Identities and Equations
Further Applications of Trigonometry
Systems of Equations and Inequalities
Analytic Geometry
Sequences, Probability & Counting Theory
Linear functions produce straight-line graphs that show a constant rate of change between two variables. Understanding their key features (slope, intercepts, and how lines relate to each other) gives you the tools to write equations from graphs, identify parallel and perpendicular lines, and solve systems of equations.
Graphing and Interpreting Linear Functions

Key features of linear functions
Linear functions have the general form , where is the slope and is the y-intercept. You'll also see this written in function notation as , which means the same thing.
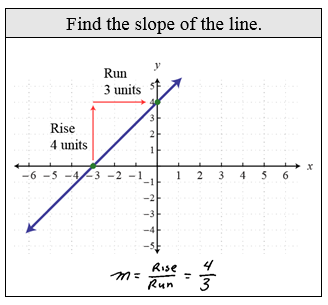
Slope () tells you the rate of change: how much changes for every 1-unit increase in .
- Calculated using two points:
- A positive slope means the line rises left to right (increasing function)
- A negative slope means the line falls left to right (decreasing function)
- A slope of zero gives a horizontal line (constant function)
- An undefined slope (division by zero) gives a vertical line, which is not a function
y-intercept () is where the line crosses the y-axis. This happens when , so the point is .
x-intercept is where the line crosses the x-axis. This happens when . To find it, set in your equation and solve for .
To graph a linear function from its equation:
- Plot the y-intercept
- From that point, use the slope to find a second point. For example, if , move right 2 units and up 3 units.
- Plot the second point and draw a straight line through both points.
Equations from linear graphs
When you're given a graph and need to find the equation:
-
Identify two clear points on the line (points that land exactly on grid intersections are best).
-
Calculate the slope:
-
Read the y-intercept directly from the graph (where the line crosses the y-axis).
-
Plug and into .
For example, if a line passes through and , the slope is . If the line crosses the y-axis at , the equation is .
Relationships Between Lines
Parallel and perpendicular lines
Parallel lines have the same slope but different y-intercepts. They never intersect.
- If one line is , any line of the form (where ) is parallel to it. For instance, .
Perpendicular lines have slopes that are negative reciprocals of each other. Their product is .
- If one line has slope , a perpendicular line has slope
- If the given line is (slope 2), a perpendicular line has slope . One example: .
A common mistake: students forget the negative part of "negative reciprocal." Flipping the fraction isn't enough; you also flip the sign.
Solving Systems of Linear Equations
Solutions to linear systems
A system of two linear equations can have one solution, no solution, or infinitely many solutions.
Graphical method: Graph both equations on the same coordinate plane.
- If the lines intersect at a single point, that point is the one solution.
- If the lines are parallel (same slope, different intercepts), there is no solution. This is called an inconsistent system.
- If the lines are identical (same slope and same intercept), every point on the line is a solution. This is called a dependent system.
Algebraic methods:
- Substitution: Solve one equation for a variable, then substitute that expression into the other equation. This works well when one variable already has a coefficient of 1.
- Elimination: Multiply one or both equations so that adding them cancels out one variable, then solve for the remaining variable.
After solving, always interpret the result in context if the problem describes a real-world scenario.

Function Properties and Representation
Domain and Range
For most linear functions, the domain (all valid inputs) and range (all valid outputs) are both all real numbers, written as .
The exceptions come from context. If a linear function models something like time or quantity, the domain might be restricted to non-negative values. A horizontal line like has a domain of all real numbers but a range of just .
Coordinate Plane
- The coordinate plane consists of two perpendicular axes: the horizontal x-axis and the vertical y-axis.
- Each point is represented as an ordered pair .
- The plane is divided into four quadrants, numbered counterclockwise starting from the upper right (Quadrant I: both positive; Quadrant II: negative, positive; Quadrant III: both negative; Quadrant IV: positive, negative).