Hypothesis Testing Concepts
Hypothesis testing gives you a structured way to decide whether sample data supports or contradicts a claim about a population. Rather than guessing, you set up competing hypotheses, collect data, and use probability to determine how convincing the evidence is. This section pulls together the core concepts and walks through full examples from start to finish.

Significance and p-value interpretation
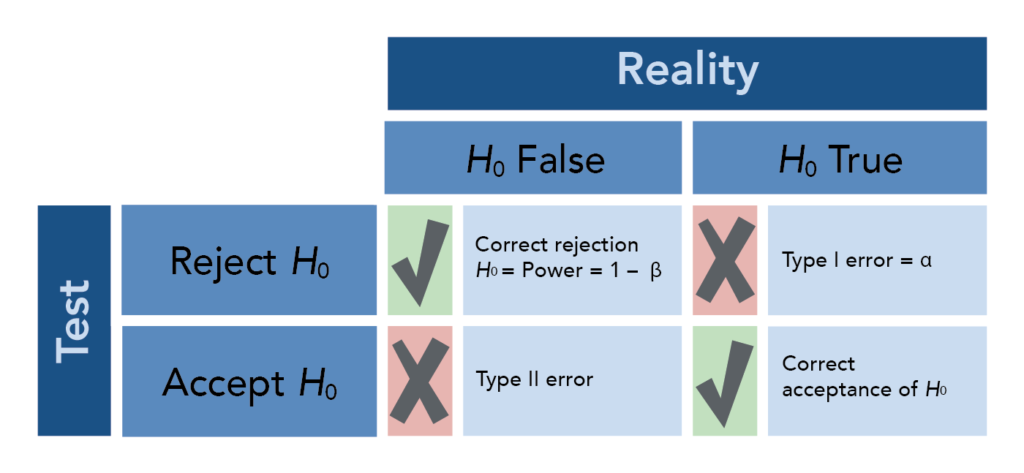
The level of significance () is the threshold you set before running the test. It represents the maximum probability of a Type I error you're willing to accept, where a Type I error means rejecting when it's actually true. Common choices are 0.01, 0.05, and 0.10.
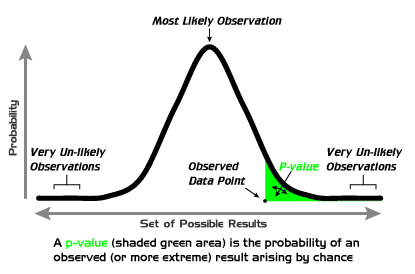
The p-value is the probability of obtaining a test statistic as extreme as (or more extreme than) what you observed, assuming is true. It comes from your sample data and gets compared directly to :
- Reject if p-value (the result is statistically significant)
- Fail to reject if p-value (the result is not statistically significant)
Think of as the bar you set, and the p-value as the evidence trying to clear that bar. A smaller p-value means stronger evidence against . For instance, a p-value of 0.001 is far more damning for than a p-value of 0.04, even though both lead to rejection at .
One more concept worth knowing: statistical power is the probability of correctly rejecting when it is actually false (i.e., detecting a real effect). Power increases with larger sample sizes and larger true effect sizes.
Types of hypothesis tests
The form of the alternative hypothesis () determines whether you're running a left-tailed, right-tailed, or two-tailed test. This matters because it dictates where the "rejection region" sits on the distribution.
- Left-tailed: . The critical region is in the left tail. Example: .
- Right-tailed: . The critical region is in the right tail. Example: .
- Two-tailed: . The critical region is split between both tails. Example: .
How you find the p-value depends on the tail direction:
- Left-tailed: p-value = area to the left of the test statistic
- Right-tailed: p-value = area to the right of the test statistic
- Two-tailed: p-value = twice the area in the more extreme tail
For the critical value approach (which you may also use), two-tailed tests split across both tails, so each tail gets . That gives you critical values of and for a z-test.
Test Planning and Interpretation
- A confidence interval complements a hypothesis test by giving a range of plausible values for the population parameter. If the hypothesized value falls outside the confidence interval, that's consistent with rejecting .
- Effect size quantifies the magnitude of the difference or relationship you're studying. A result can be statistically significant but have a tiny effect size, meaning it may not matter much in practice.
- Sample size should be determined before collecting data. Larger samples increase power and precision, making it more likely you'll detect a real effect if one exists.
Full Hypothesis Test Examples
Single population proportion test
Here's the general procedure, followed by a worked example.
The steps:
-
State the hypotheses. Write where is the claimed proportion. Then write based on the research question: , , or .
-
Set the significance level (), typically given in the problem.
-
Check conditions. Verify that and so the normal approximation is valid.
-
Calculate the test statistic:
where is the sample proportion and is the sample size. 5. Find the p-value using the standard normal distribution, based on the direction of . 6. Make a decision. Reject if p-value ; fail to reject if p-value . 7. Interpret in context. State your conclusion in plain language, referring back to the original claim.
Worked example:
A school claims that 70% of its graduates attend a four-year college. A counselor suspects the true rate is lower. She surveys 150 recent graduates and finds that 96 attended a four-year college. Test at .
-
and (left-tailed, since the counselor suspects lower)
-
-
Check conditions: and . Conditions met.
-
Sample proportion:
- Since this is left-tailed, the p-value is the area to the left of . From the standard normal table, p-value .
- Since , we fail to reject .
- At the 0.05 significance level, there is not sufficient evidence to conclude that the proportion of graduates attending a four-year college is less than 70%.
Notice how close this was. The p-value barely missed the cutoff. That doesn't mean the claim is true; it means the sample didn't provide strong enough evidence to reject it at this threshold. A larger sample might yield a different result.
Single population mean test (z-test)
When the population standard deviation () is known and the sample is large or the population is normal, you use a z-test for the mean.
The steps:
- State the hypotheses. and , , or .
- Set .
- Calculate the test statistic:
where is the sample mean, is the hypothesized mean, is the known population standard deviation, and is the sample size. 4. Find the p-value from the standard normal distribution. 5. Compare p-value to and make a decision. 6. Interpret in context.
Worked example:
A battery manufacturer claims their batteries last an average of 500 hours. A consumer group tests 40 batteries and finds a sample mean of 490 hours. The population standard deviation is known to be 25 hours. Test at whether the true mean is less than claimed.
- and (left-tailed)
- Test statistic:
- Left-tailed p-value: area to the left of .
- Since , we reject .
- At the 0.05 significance level, there is sufficient evidence to conclude that the mean battery life is less than 500 hours. The consumer group's concern appears justified.
Common mistakes to avoid
- Writing "accept " instead of "fail to reject ." You never prove the null is true; you just didn't find enough evidence against it.
- Using in the denominator of the proportion z-test formula. The standard error for hypothesis testing uses (the hypothesized value), not .
- Forgetting to double the tail area for two-tailed tests. If your test statistic gives a one-tail area of 0.03, the two-tailed p-value is 0.06.
- Confusing statistical significance with practical significance. A very large sample can make a tiny, meaningless difference statistically significant. Always consider effect size alongside your p-value.
- Setting after seeing the data. The significance level must be chosen before the test is conducted, or you risk biasing your conclusion.