Chi-Square Tests
Chi-square tests let you analyze categorical data by comparing what you actually observe to what you'd expect under some assumption. All three types use the same core formula, but they answer fundamentally different questions. Knowing which test to use, and why, is the main challenge here.
Each test calculates a chi-square statistic from observed and expected frequencies, then uses degrees of freedom to find a p-value. The decision framework is the same across all three; what changes is the setup: how many populations, how many variables, and what the null hypothesis claims.

Goodness-of-Fit vs. Independence vs. Homogeneity
These three tests look similar in mechanics but differ in structure and purpose.
Goodness-of-fit tests whether a single categorical variable's distribution matches a specific claimed distribution. You have one population and one variable. You're comparing observed frequencies against expected frequencies derived from the hypothesized proportions.
Example: A candy company claims their bags are 20% red, 30% blue, and 50% green. You count the colors in a sample bag and test whether the observed counts match those claimed proportions.
Independence tests whether two categorical variables are related within a single population. You have one population but two variables, and you're asking: does knowing one variable tell you anything about the other?
Example: You survey one group of consumers and record both gender and product preference. The question is whether product preference differs by gender, or whether the two variables are independent.
Data for independence tests gets organized into a contingency table (rows for one variable, columns for the other).
Homogeneity tests whether the distribution of a single categorical variable is the same across two or more populations. You have multiple populations but one variable.
Example: You survey voters in three different age groups and ask which candidate they support. The question is whether the distribution of candidate support is consistent across age groups.
A common point of confusion: independence and homogeneity tests both use contingency tables and the same formula for expected counts. The difference is in the study design. Independence starts with one sample and measures two variables on each subject. Homogeneity starts with separate samples from distinct populations and measures one variable.
Null and Alternative Hypotheses
Each test has its own hypothesis structure:
- Goodness-of-fit
- : The data follows the hypothesized distribution (observed proportions match expected proportions)
- : The data does not follow the hypothesized distribution
- Independence
- : The two categorical variables are independent
- : The two categorical variables are not independent (they are associated)
- Homogeneity
- : The distribution of the categorical variable is the same across all populations
- : The distribution differs for at least one population
Notice that all three alternative hypotheses are non-directional. Chi-square tests only detect that something deviates from the null; they don't tell you how it deviates. If you reject , you'll need to look at individual cell contributions to understand where the differences are.
Populations and Variables at a Glance
| Test | # of Populations | # of Variables | What You're Comparing |
|---|---|---|---|
| Goodness-of-fit | 1 | 1 | Observed vs. hypothesized distribution |
| Independence | 1 | 2 | Whether two variables are related |
| Homogeneity | 2+ | 1 | Whether distributions match across groups |
Chi-Square Test Statistic and Interpretation
All three tests use the same test statistic formula:
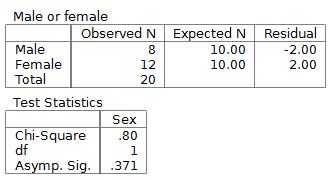
where is each observed frequency and is the corresponding expected frequency. Each cell contributes one term to the sum, and larger differences between observed and expected values push higher.
Degrees of freedom differ by test type:
- Goodness-of-fit: , where is the number of categories
- Independence and homogeneity: , where is the number of rows and is the number of columns in the contingency table
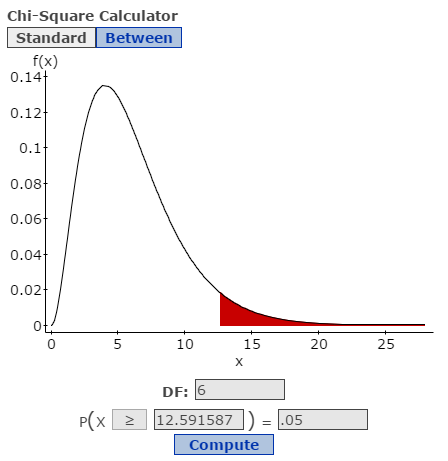
The p-value comes from the right tail of the chi-square distribution. A larger means a smaller p-value, which means stronger evidence against . You can also compare to a critical value from a chi-square table at your chosen significance level. If exceeds the critical value, you reject .
One thing to watch: the chi-square approximation works well only when expected frequencies are large enough. The standard rule is that every expected cell count should be at least 5. If some cells fall below that threshold, you may need to combine categories or use a different method.