Matched or Paired Samples
Matched or paired samples let you compare two measurements that are connected to each other, like the same person measured before and after a treatment. By looking at the difference within each pair rather than comparing two separate groups, you cut out a lot of noise from individual variability. This makes it easier to detect a real effect when one exists.

Matched vs. Independent Samples
Understanding the distinction between these two designs is central to choosing the right test.
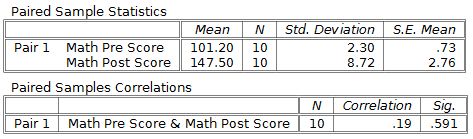
Matched (paired) samples involve two measurements taken on the same individuals or on deliberately paired subjects. You compute a difference for each pair, then analyze those differences.
- Before-and-after measurements on the same person (e.g., blood pressure before and after medication)
- Twin studies comparing one twin to the other
- Matched case-control studies where each case is paired with a similar control based on age, sex, etc.
- Because you're looking at within-subject change, between-subject variability drops out, giving you more statistical power with fewer subjects
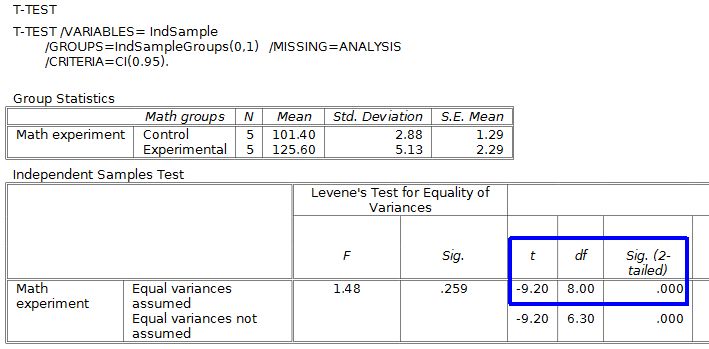
Independent samples involve two completely separate groups with no pairing between them.
- Subjects are randomly assigned to one group or the other (e.g., drug vs. placebo in a randomized trial)
- You compare the two group means directly, so all individual variability stays in the analysis
- Typically requires larger sample sizes to reach the same power as a paired design
The key trade-off: paired designs are more powerful when pairing is meaningful, but they require that a logical pairing actually exists. If there's no natural way to pair observations, use independent samples.
Test Statistic for Matched Samples
Once you've computed the difference for each pair, you treat those differences as a single sample and run a one-sample -test on them.
- = mean of the paired differences
- = hypothesized mean difference (almost always 0, representing "no change")
- = standard deviation of the paired differences
- = number of pairs (not the total number of individual observations)
How to carry out the test, step by step:
-
Compute the difference for each pair (e.g., "after" minus "before").
-
Calculate and from those differences.
-
Plug into the formula above to get the -statistic.
-
Determine degrees of freedom: .
-
Find the -value using the -distribution with .
-
Compare the -value to your significance level and draw your conclusion.
A larger absolute -value means the observed mean difference is farther from the hypothesized value relative to the spread, which gives stronger evidence against the null hypothesis.
Choosing Matched Pairs vs. Independent Samples
Use a paired design when:
- The same subjects are measured twice (before/after, two time points, two conditions)
- Subjects can be meaningfully matched on characteristics that affect the outcome
- Reducing subject-to-subject variability matters for detecting a small effect
Use independent samples when:
- Two separate, unrelated groups are being compared
- Random assignment to groups is feasible and ethical
- There's no natural or practical way to pair observations
For example, comparing a patient's cholesterol before and after starting a statin is a natural paired design. Comparing average cholesterol between patients at two different clinics is an independent-samples problem.
Additional Considerations for Matched Designs
- Blocking is a related idea: you group experimental units that are similar (a "block") and then assign treatments within each block. Paired designs are the simplest case of blocking, where each block has exactly two units.
- McNemar's test applies when your paired data has binary (yes/no) outcomes rather than continuous measurements. For instance, if you record whether each patient's symptom is present or absent before and after treatment, McNemar's test is the appropriate paired analysis.