Introduction to Statistics and Probability
Statistics provides the tools to organize information, identify patterns, and draw conclusions from data. More than just number-crunching, statistical thinking lets you move from describing what you observe to making predictions about larger groups you haven't fully measured. This section covers the foundational vocabulary and concepts you'll use throughout the course.
Statistical models are built to handle uncertainty. Unlike formulas that give you one exact answer every time, statistical models account for randomness and variability in real-world data. Understanding the difference matters because almost every real dataset has some unpredictability baked in.

Descriptive vs. Inferential Statistics
These are the two major branches of statistics, and the distinction comes up constantly.
Descriptive statistics organizes, summarizes, and presents data to describe what's in a dataset. It answers the question: What does this data look like?
- Calculates measures of central tendency like mean, median, or mode to summarize a "typical" value
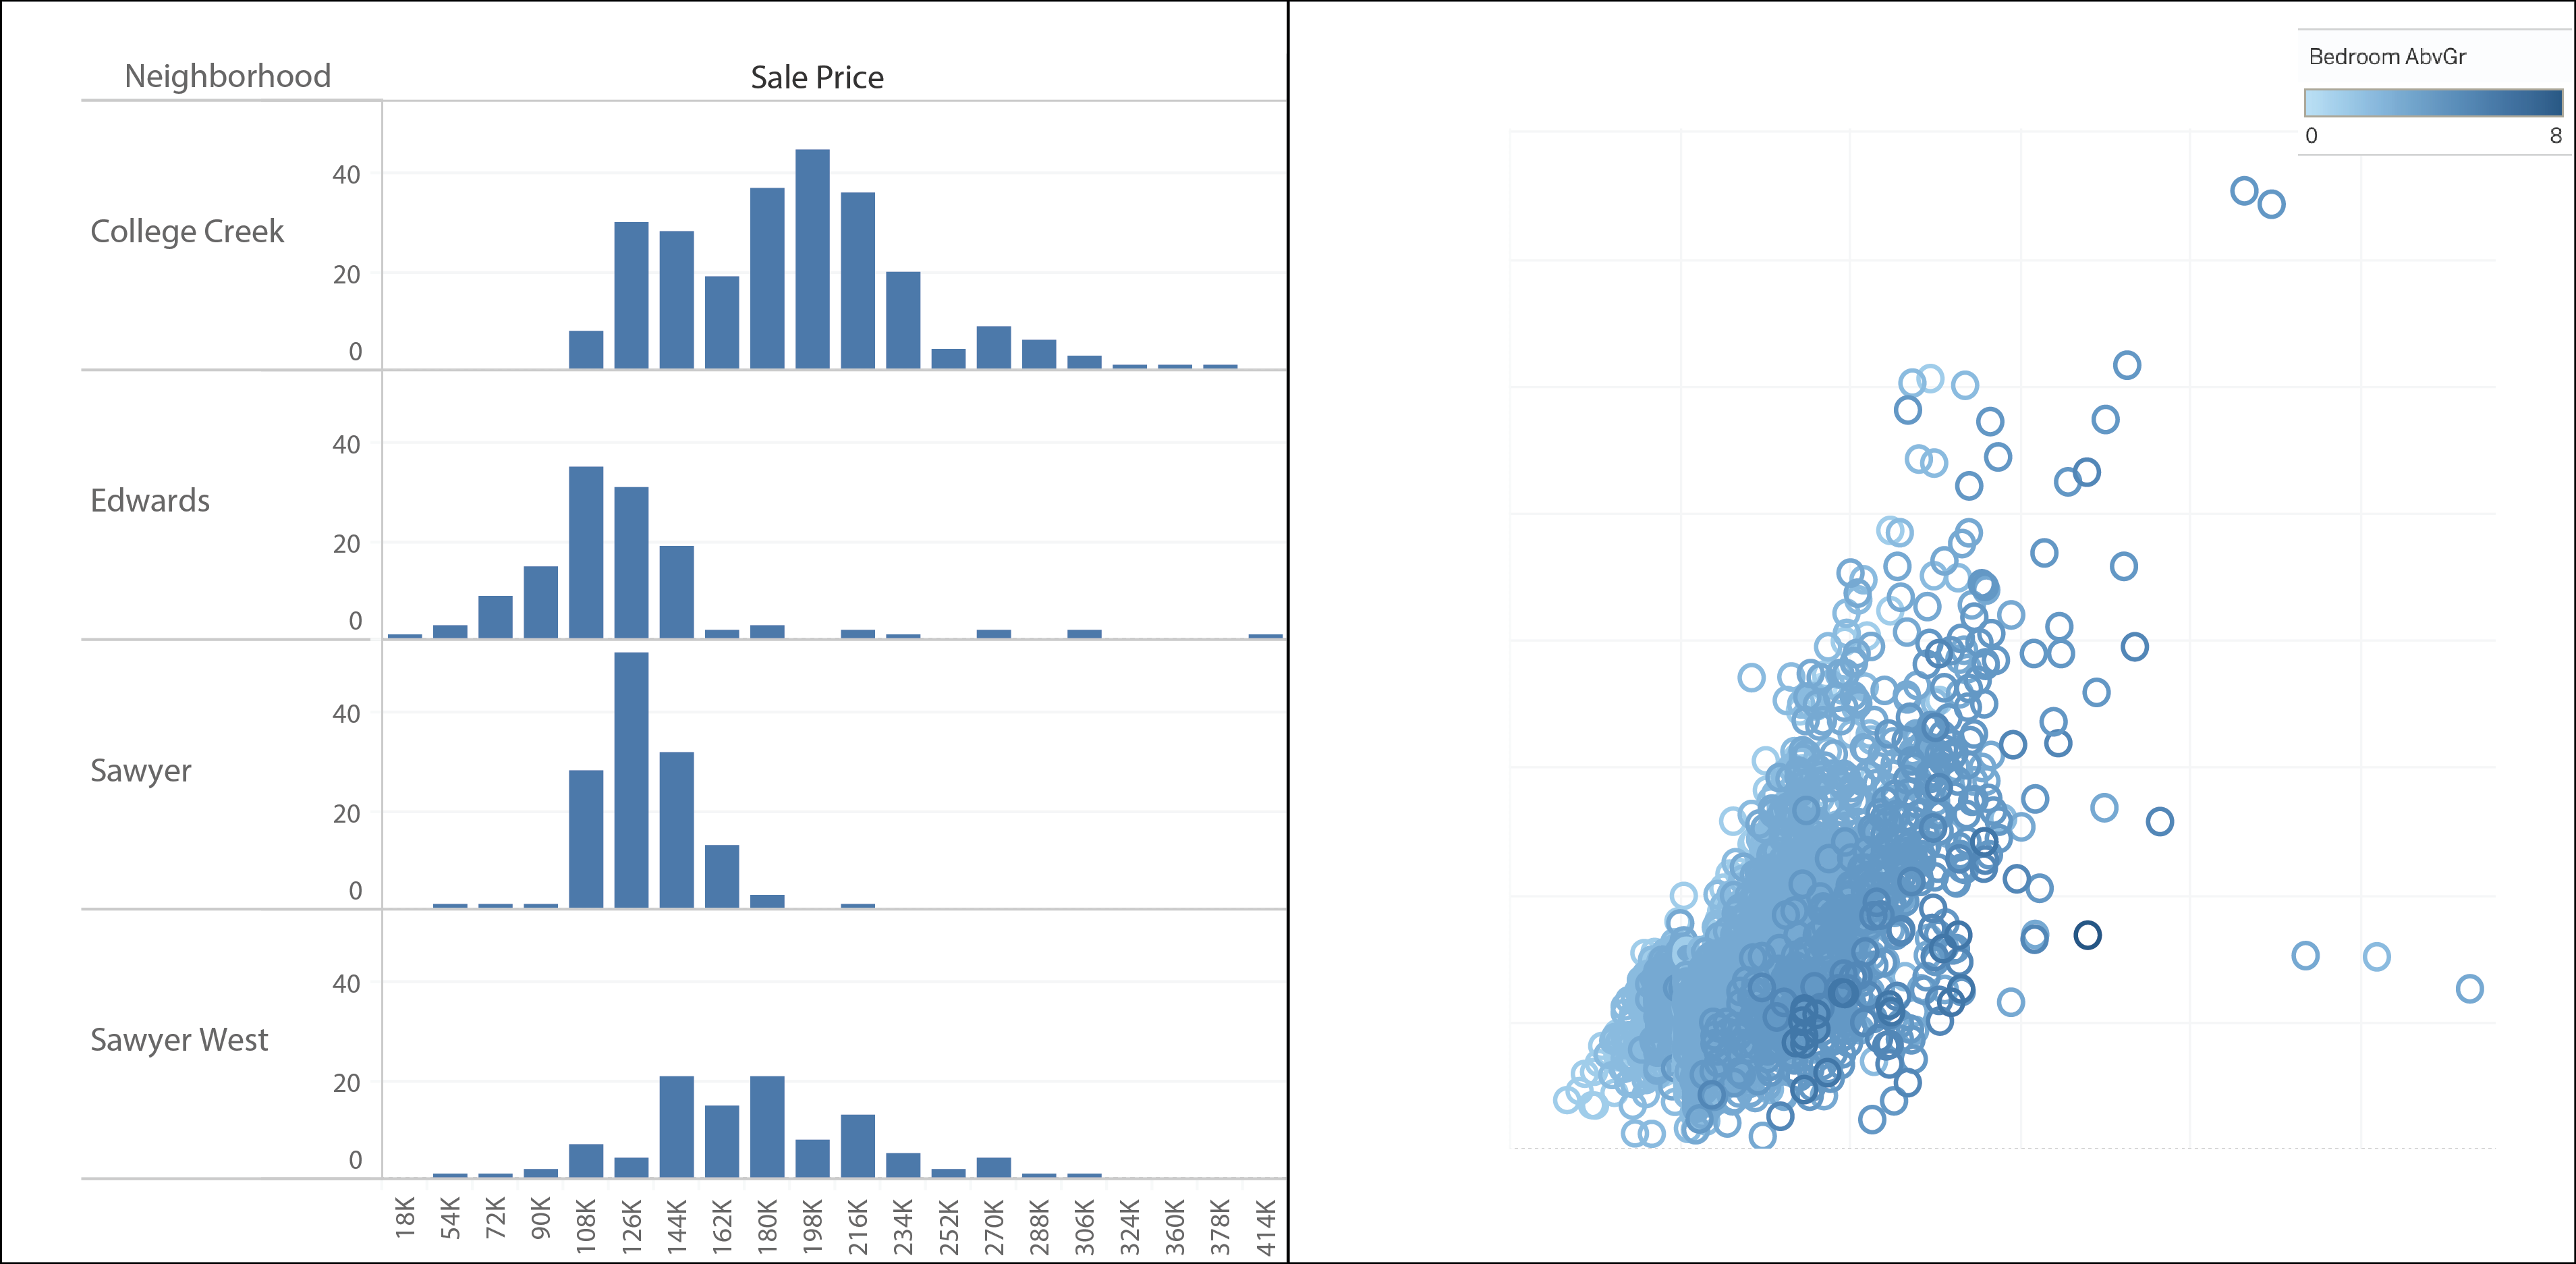
- Uses visualizations like histograms or box plots to show how data is distributed
- Reports measures of spread like standard deviation or variance to quantify how far data points are from the center
Inferential statistics uses sample data to generalize or make predictions about a larger population. It answers the question: What can this data tell us beyond itself?
- Conducts hypothesis tests to determine whether differences between groups (e.g., treatment vs. control) are statistically significant or just due to chance
- Constructs confidence intervals to estimate unknown population parameters, such as a population mean or proportion
- Performs regression analysis to model relationships between variables and make predictions (e.g., predicting sales based on advertising spend)
The key difference: descriptive statistics summarizes what you have, while inferential statistics draws conclusions about what you don't have.

Statistical Models for Uncertainty
Statistical models make predictions or decisions under uncertainty by incorporating randomness and variability into their structure.
- They account for inherent uncertainty in the system being modeled. For example, students who study the same number of hours won't all earn the same GPA, so a statistical model captures that individual variation.
- They estimate probabilities of outcomes based on input factors, such as the likelihood of a customer making a purchase given their demographics.
Deterministic models, by contrast, produce exact outcomes from their inputs with no randomness involved.
- A formula like gives you the precise area of a circle from its radius every time.
- The kinematic equation determines final velocity exactly from initial velocity, acceleration, and time.
The distinction is straightforward: if the same inputs always produce the same output, it's deterministic. If the same inputs can produce different outputs because of natural variability, you need a statistical model.
Key Terms in Statistics
These definitions are foundational. You'll use them in nearly every unit, so make sure you can distinguish between them clearly.
Population refers to the entire group of individuals, objects, or events you're interested in studying. If you're researching voting preferences, the population might be all registered voters in a state. Populations are often too large to study completely.
Sample is a subset of the population selected for study. Instead of surveying every registered voter, you might survey 1,000 of them. Sampling is the process of selecting that subset, and how you sample matters enormously for whether your conclusions are valid.
Parameter is a numerical value that describes a characteristic of the whole population. The population mean is written as and the population standard deviation as . In practice, you rarely know the true parameter, which is exactly why you collect samples.
Statistic is a numerical value calculated from sample data, used to estimate the corresponding parameter. The sample mean () estimates ; the sample standard deviation () estimates .
Parameters describe populations. Statistics describe samples. A helpful mnemonic: parameter goes with population, statistic goes with sample.
Variable is a characteristic or attribute that can take on different values across individuals in a dataset.
- Quantitative variables have numeric values where arithmetic makes sense (height, weight, age, test scores)
- Categorical variables place individuals into groups or categories (gender, eye color, nationality, class year)
- A random variable is a variable whose value is determined by the outcome of a random process
Data is the collection of observations or measurements recorded on variables. Data can be quantitative (reaction times, exam scores) or categorical (survey responses, product ratings). A single data point is called a datum, though you'll almost always work with sets of data.
Probability and Statistical Inference
Probability is the mathematical foundation that makes inferential statistics possible. A few terms to know at this stage:
- A probability distribution describes the likelihood of each possible outcome for a random variable. Think of it as a map showing how probable different results are.
- The null hypothesis is a default statement of no effect or no difference. In hypothesis testing, you collect evidence to decide whether to reject this assumption.
- Correlation measures the strength and direction of the linear relationship between two quantitative variables, ranging from to . A correlation of means no linear relationship; values near indicate a strong one.
These concepts will be developed in much greater depth later in the course. For now, recognize that probability gives us the framework to quantify how confident we can be in conclusions drawn from sample data.