The production possibilities curve (PPC) is a model that shows every efficient combination of two goods an economy can produce with its current resources and technology. It illustrates scarcity, opportunity cost, efficiency, underused resources, and economic growth, and you can use it to calculate the opportunity cost of shifting production from one good to another.
Why This Matters for the AP Microeconomics Exam
The PPC is the first graphing model in AP Microeconomics, and the skills you build here show up across the whole course. You need to be able to define PPC terms, explain what different points and shifts mean, and calculate opportunity cost from a graph or table.
This topic trains three things the exam rewards:
- Reading and interpreting a model accurately, including points on, inside, and outside the curve.
- Connecting a cause (more resources, new technology, unemployment) to an effect on the curve.
- Doing clean opportunity cost calculations and showing your work.
Graphing is tested in the free-response section, so getting comfortable with labeled axes, curves, and movement versus shifts now pays off in later units.

Key Takeaways
- The PPC shows the trade-offs of producing two goods with fixed resources and fixed technology.
- Points on the curve are productively efficient; points inside show underutilized resources; points outside are currently unattainable.
- Opportunity cost equals what you give up of one good to gain more of the other, and it shows up as the slope of the curve.
- A bowed-out (concave) PPC means increasing opportunity cost; a straight-line PPC means constant opportunity cost.
- Economic growth shifts the PPC outward; economic contraction shifts it inward.
- Shifts come from changes in factors of production or changes in productivity and technology.
What Are Production Possibilities?
Production possibilities are the different combinations of goods and services an economy can produce given its limited resources and current technology. Put simply, with a fixed amount of materials, you can make different amounts of different goods, but you cannot make unlimited amounts of everything.
A classic teaching example uses two goods: guns and butter. This is a common illustration meant to represent capital goods versus consumer goods, and it is an example, not required AP content. Every time the economy makes more butter, it uses up resources that could have made guns, and the reverse is also true.
There are many possible combinations of guns and butter. Suppose the economy could use all its resources to make 10 guns, or all its resources to make 5 units of butter, or some mix like 5 guns and 2.5 butter, or 2 guns and 4 butter (assuming the goods are infinitely divisible). As long as these combinations use all available resources, they are efficient outputs.
What about making just 1 gun and 1 butter? You could, but that would not use all your resources. That is an underutilization, because you could make more of one good or both without giving anything up.
What about 100 guns and 100 butter? You do not have enough resources for that, so it is an unattainable combination.
The Production Possibilities Curve (PPC)
The production possibilities curve (PPC), also called the production possibilities frontier (PPF), is the first graph you study in microeconomics. It visualizes production possibilities for two goods. The model rests on three assumptions:
- Only two goods can be made.
- Resources are fixed.
- Technology is fixed.
The PPC lets you analyze how changes in resources, technology, and other factors affect what an economy can produce. It also helps you compare efficiency and evaluate the trade-offs in different choices.
Here is what a PPC looks like:

The curve represents every combination of butter and guns that efficiently uses all resources. Producing on the curve is productive efficiency. A point inside the curve represents underutilization, because you could produce more of either good without giving up the other. A point above the curve is unattainable, because it requires more resources than the economy has.
Reading Points on a PPC
- Productive efficiency: any point on the curve, where the economy produces at the lowest cost and fully uses its resources.
- Allocative efficiency: the single point on the curve that best matches what society actually wants. If a society wants roughly equal amounts of two goods, the allocatively efficient point is the spot on the curve that delivers that mix.
- Inefficient point (inside the curve): resources are underutilized, which can represent higher than normal unemployment.
- Unattainable point (outside the curve): the economy does not have enough resources to reach this combination right now.
Opportunity Cost and the PPC
The PPC is one of the clearest ways to measure opportunity cost, which is the value of what you give up when you make a trade-off. With the butter and guns example, choosing to make more butter means giving up some guns. On the graph, this shows up as movement along the curve.
As you move right and produce more butter, you have to produce fewer guns to stay on the curve. If you tried to keep the same number of guns while gaining butter, you would move above the curve, which is unattainable. The drop in guns is the opportunity cost of the extra butter.
Increasing vs. Constant Opportunity Cost
The shape of the PPC tells you how opportunity cost behaves.
With a bowed-out (concave) curve, opportunity cost increases as you produce more of a good. Each additional unit of butter costs more and more guns. Putting numbers to it: suppose one move gains 5 butter and gives up 2 guns, so the opportunity cost is 2/5 = 0.4 guns per butter. A later move gains 3 butter but gives up 5 guns, so the opportunity cost is 5/3 = about 1.67 guns per butter. The cost per unit rises as you go.
Think of opportunity cost as the slope of the PPC. The steeper the curve between two points, the higher the opportunity cost.
Opportunity cost can also be constant. That means you give up the same amount of one good for each unit of the other no matter where you are on the curve. A constant opportunity cost shows up as a straight-line PPC with a constant slope.
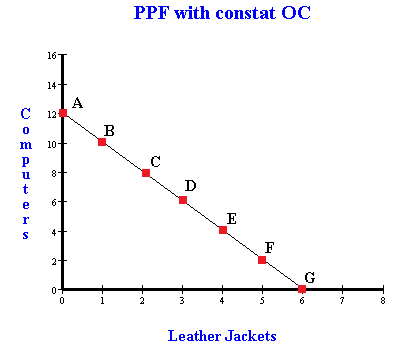
Try moving between two adjacent points on each type of curve and check how the opportunity cost changes or stays the same.
Economic Growth and Contraction
The PPC can also represent changes in the size of the economy.
Economic growth is shown by an outward (rightward) shift of the whole curve. When the economy grows, it can produce more of both goods, and some combinations that were unattainable become attainable.
Economic contraction is shown by an inward (leftward) shift of the curve. The economy can now produce less of both goods than before.
What Shifts the PPC
A few things can shift the entire curve:
- A change in the quantity or quality of resources (factors of production).
- A change in productivity or technology.
The PPC can show how these changes move the curve and how the economy moves between efficient and inefficient production.
Some shifts affect both goods, like an improvement in the quality of human capital or a rise in the number of workers, which shifts the whole curve outward. Other changes affect only one good. For example, a technology improvement that helps produce just one good rotates the curve outward along that good's axis while the other intercept stays the same. A drop in the quantity of resources, like fewer workers, shifts the curve inward.
Keep the difference clear: moving to a different point on the same curve is a trade-off and shows opportunity cost, while a shift of the whole curve changes what the economy is capable of producing.
How to Use This on the AP Microeconomics Exam
Problem Solving
- To calculate opportunity cost between two points, divide what you give up by what you gain. For "guns given up per butter," compute (guns lost) / (butter gained).
- Watch the direction of the trade-off. The opportunity cost of butter is measured in guns, and the opportunity cost of guns is measured in butter, so they are reciprocals.
- A bowed-out curve gives a different opportunity cost in each region; a straight line gives the same value everywhere.
Free Response
- Label both axes with the two goods and label the curve.
- Use a point inside the curve to show unemployment or underutilized resources.
- Use an outward shift for growth and an inward shift for contraction, and say what caused the shift.
- If only one good is affected by a change, rotate the curve along that good's axis instead of shifting the whole thing.
Common Trap
- A movement along the curve is not the same as a shift of the curve. Movement shows opportunity cost; a shift changes the economy's capacity.
Common Misconceptions
- A point inside the curve is not "impossible." It is fully attainable; it just wastes resources. The impossible points are outside the curve.
- A straight-line PPC does not mean there is no opportunity cost. It means opportunity cost is constant, not zero. You still give up units of one good for the other.
- A bowed-out curve is not a graphing error. The bow shows increasing opportunity cost because resources are not equally good at producing both goods.
- Economic growth is a shift, not a move to a point outside the curve. You cannot reach an unattainable point without first shifting the curve outward.
- Opportunity cost is what you give up, not what you keep. When you move along the curve, the opportunity cost is the amount of the other good you sacrifice.
- More of one resource does not always shift both intercepts. A change that helps only one good rotates the curve and leaves the other good's maximum unchanged.
Related AP Microeconomics Guides
Vocabulary
The following words are mentioned explicitly in the College Board Course and Exam Description for this topic.Term | Definition |
|---|---|
constant opportunity costs | A situation where the opportunity cost of producing one good remains the same regardless of the quantity produced, resulting in a linear PPC. |
decreasing opportunity costs | A situation where the opportunity cost of producing one good decreases as more of that good is produced, resulting in a bowed-in PPC. |
economic contraction | A decrease in the economy's productive capacity, represented by an inward shift of the production possibilities curve. |
economic growth | An increase in the economy's productive capacity, represented by an outward shift of the production possibilities curve. |
efficiency | A market outcome where resources are allocated to maximize total surplus and no mutually beneficial trades remain unexploited. |
factors of production | The resources used to produce goods and services, including land, labor, capital, and entrepreneurship. |
increasing opportunity costs | A situation where the opportunity cost of producing one good increases as more of that good is produced, resulting in a bowed-out PPC. |
inefficiency | A situation where resources are not being used optimally, resulting in production at a point inside the production possibilities curve. |
opportunity cost | The value of the next best alternative that must be given up when making an economic choice. |
production possibilities curve | A model that shows the maximum combinations of two goods or services an economy can produce with available resources and technology, illustrating trade-offs in resource allocation. |
productivity | The output produced per unit of factor input, which influences a firm's decision to hire factors of production. |
scarcity | The fundamental economic problem that arises because most resources are limited while human wants and needs are unlimited, forcing individuals and societies to make choices. |
technology | Methods and tools used in production that can affect the efficiency and cost of producing goods, thereby influencing supply decisions. |
trade-offs | The choices involved in selecting between competing alternatives, where gaining more of one thing requires giving up some of another. |
underutilized resources | Resources that are not being used to their full productive capacity, represented by points inside the PPC. |
Frequently Asked Questions
What is a production possibilities curve?
A production possibilities curve, or PPC, is a model that shows the efficient combinations of two goods an economy can produce with current resources and technology. It illustrates scarcity, trade-offs, opportunity cost, efficiency, and growth.
What does a point inside the PPC mean?
A point inside the PPC is attainable but inefficient. It means resources are underutilized, such as when labor, land, capital, or entrepreneurship is not being used fully.
What does a point outside the PPC mean?
A point outside the PPC is currently unattainable with the economy's existing resources and technology. It can become attainable only if the PPC shifts outward through growth or productivity gains.
How do you calculate opportunity cost from a PPC?
To calculate opportunity cost, divide what is given up by what is gained. If producing more of good A requires giving up units of good B, the opportunity cost of A is units of B lost per unit of A gained.
What is the difference between constant and increasing opportunity cost?
Constant opportunity cost appears as a straight-line PPC with the same trade-off everywhere. Increasing opportunity cost appears as a bowed-out PPC because resources are not equally suited to producing both goods.
What shifts the production possibilities curve?
The PPC shifts when factors of production, productivity, or technology change. Economic growth shifts the curve outward, while a loss of resources or productivity can shift it inward.