📊Actuarial Mathematics Unit 9 Review
9.3 Stochastic reserving and bootstrapping
9.3 Stochastic reserving and bootstrapping
Unit & Topic Study Guides
Probability Theory & Distributions
Stochastic Processes & Time Series
Financial Mathematics and Interest
Life Contingencies & Survival Models
Risk Theory and Insurance Models
Credibility Theory & Experience Rating
Loss Models & Severity Distributions
Ruin Theory & Surplus Processes
Actuarial reserving methods
Pension Math and Retirement Planning
Actuarial Modeling & Statistical Methods
Stochastic vs Deterministic Reserving
Deterministic reserving methods like the chain-ladder technique produce a single point estimate of future claims liabilities. That number is useful, but it tells you nothing about how wrong it might be. Stochastic reserving fills that gap by explicitly modeling the uncertainty in claims development, producing a full distribution of possible reserve outcomes rather than one fixed answer.
This distinction matters for capital allocation, regulatory compliance, and risk management. If you only have a point estimate, you can't answer questions like "What reserve level gives us 99.5% confidence of adequacy?" Stochastic methods can.
Limitations of Deterministic Methods
- They provide no measure of uncertainty around the reserve estimate, so you can't assess reserve adequacy in probabilistic terms.
- Results are sensitive to assumption choices (which development factors you pick, how you handle outliers) with no systematic way to quantify that sensitivity.
- Volatile or irregular development patterns can produce misleading point estimates, since the method assumes future development mirrors the past in a fixed way.
Advantages of Stochastic Approaches
- You get a full reserve distribution, not just a single number, enabling probabilistic statements about reserve adequacy.
- Reserve uncertainty can be quantified directly, supporting capital modeling and solvency requirements.
- The framework is flexible enough to incorporate expert judgment, market data, or alternative distributional assumptions alongside the empirical claims data.
Bootstrapping in Reserving
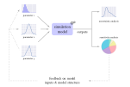
Bootstrapping is a resampling technique that builds a reserve distribution from your existing claims triangle without requiring strong parametric assumptions about the data-generating process. The core idea: treat the historical data as a proxy for the true underlying distribution, then repeatedly resample from it to see how much the reserve estimate varies.
Bootstrapping Process Overview
The standard bootstrapping procedure for reserving works as follows:
- Fit a base model to the observed claims triangle (typically an over-dispersed Poisson or log-normal chain-ladder model) and extract the Pearson residuals from the fit.
- Resample the residuals with replacement to create a new set of pseudo-residuals.
- Reconstruct a pseudo-data triangle by applying the resampled residuals back to the fitted values from the base model.
- Re-estimate loss development factors (LDFs) from each pseudo-triangle and project future claims to obtain a reserve estimate for that iteration.
- Optionally add process variance by simulating from the assumed distribution (e.g., over-dispersed Poisson) around the projected values, so the final distribution reflects both parameter uncertainty and process uncertainty.
- Repeat steps 2 through 5 thousands of times (commonly 10,000 iterations) to build up the reserve distribution.
A critical detail: you resample the residuals, not the raw claims data directly. This preserves the structural relationships in the triangle (the row and column effects) while still capturing variability.
Sampling with Replacement
Sampling with replacement means each residual can be drawn more than once in a given iteration, and some residuals may not appear at all. This is what generates variation across pseudo-triangles. Because each draw is independent and every residual has equal probability of selection, the bootstrapped samples preserve the overall distributional characteristics of the original residuals while producing genuinely different realizations of the data.
Loss Development Factors (LDFs)
LDFs (also called link ratios or development factors) measure how cumulative claims grow from one development period to the next. For development period , the LDF is:
where is the cumulative claims for accident year at development year , and the sum runs over all accident years with data at both periods and . This is the volume-weighted average; simple arithmetic averages across individual ratios are also used but give equal weight to each accident year regardless of size.
Estimating LDFs from Data
- The chain-ladder method estimates LDFs by averaging observed link ratios across accident years for each development period.
- Volume-weighted averages (the formula above) are standard because they give more influence to larger accident years, which tend to be more stable.
- Alternative selections include excluding high/low ratios, using only recent years, or applying exponential smoothing. The choice of averaging method is itself a source of uncertainty.
Variability in LDF Estimates
Each bootstrap iteration produces a different pseudo-triangle, which yields a different set of LDFs. Across thousands of iterations, you get a distribution for each . Early development periods (small ) typically show less relative variability because they're estimated from more data points. Later development periods, estimated from fewer accident years, tend to have wider distributions. This variability in LDFs is one of the primary drivers of reserve uncertainty.
Simulating Future Claims Development
Applying Bootstrapped LDFs
For each bootstrap iteration:
- Take the set of LDFs estimated from that iteration's pseudo-triangle.
- Apply them sequentially to the latest observed cumulative claims for each accident year: .
- Continue projecting until each accident year reaches ultimate development.
If you're incorporating process variance, you don't just multiply by deterministically. Instead, you simulate the next period's cumulative claims from the assumed distribution (e.g., drawing from an over-dispersed Poisson with mean ). This adds realistic noise to each projected cell.
Generating Reserve Distributions
The reserve for accident year in a given iteration is:
The total reserve is . Repeating this across all iterations produces the reserve distribution. From this distribution you can read off the mean reserve, the standard deviation, any percentile you need, and the full shape of the uncertainty.
Assessing Reserve Variability
Quantifying Uncertainty in Reserves
The reserve distribution from bootstrapping is typically summarized by:
- Mean and median for central tendency (these often differ because reserve distributions tend to be right-skewed).
- Standard deviation or coefficient of variation for overall dispersion.
- Percentiles (e.g., 75th, 90th, 95th, 99.5th) for specific confidence levels.
The gap between, say, the 75th and 25th percentiles gives a quick sense of how spread out the distribution is. A wide distribution signals high reserve uncertainty, which has direct implications for how much capital the insurer needs to hold.
Value at Risk (VaR) and Tail VaR
VaR at confidence level is the -th percentile of the reserve distribution. For example, is the reserve level that's sufficient in 99.5% of simulated scenarios. Under Solvency II, this is the standard for the one-year reserve risk capital requirement.
Tail VaR (also called Conditional VaR or Expected Shortfall) is the average of all reserve outcomes that exceed the VaR threshold:
Tail VaR is a more conservative measure because it accounts for how bad the tail scenarios are, not just where the tail starts. It's also a coherent risk measure (it satisfies subadditivity), whereas VaR is not, which matters when aggregating risks across lines of business.
Model Validation and Diagnostics
Bootstrapping results are only as reliable as the underlying model. Validation is not optional.
Goodness-of-Fit Tests
- The chi-square test or Kolmogorov-Smirnov test can assess whether the model's fitted values are consistent with the observed data.
- These tests compare the distribution of residuals to the expected distribution under the model assumptions (e.g., that residuals are independent and identically distributed).
- A poor fit suggests the model structure is wrong, which means the bootstrap distribution may not accurately reflect true reserve uncertainty.
Residual Analysis
Residual analysis is often more informative than formal tests. Plot the Pearson residuals against:
- Development year to check for trends in volatility across the development period.
- Accident year to detect shifts in claims behavior over time (e.g., due to underwriting changes).
- Calendar year to identify diagonal effects like claims inflation or regulatory changes.
If you see systematic patterns (e.g., residuals trending upward for recent accident years, or consistently positive residuals in a particular calendar year), the model assumptions are likely violated. You may need to adjust for calendar-year effects, exclude certain years, or use a different model structure before bootstrapping.
Incorporating External Information
Market Data and Expert Judgment
Pure bootstrapping relies entirely on the historical triangle. In practice, you often know things the data alone can't tell you:
- Claims inflation may be accelerating due to economic conditions, so projected LDFs should be adjusted upward.
- Legislative changes (e.g., new compensation caps) could alter future development patterns.
- Expert judgment from claims managers about large pending claims or changes in settlement practices can inform adjustments to the tail factors.
These adjustments are typically applied as modifications to the projected values or LDFs before or during the simulation process.
Bayesian Bootstrapping Approaches
Bayesian bootstrapping extends the standard method by incorporating prior distributions on model parameters (such as LDFs or the dispersion parameter). The process works as follows:
- Specify a prior distribution reflecting your beliefs or external information about the parameters.
- Combine the prior with the likelihood from the observed data to obtain a posterior distribution.
- Resample from the posterior rather than from the raw residuals.
The result is a reserve distribution that blends empirical evidence with prior knowledge. This is particularly useful when the data is sparse (e.g., long-tail lines with few mature accident years) and you want to stabilize estimates using industry benchmarks or expert opinion. The trade-off is that results become sensitive to the choice of prior, so prior selection should be justified and its impact tested through sensitivity analysis.
Advantages and Limitations
Comparison to Chain-Ladder Method
The chain-ladder method and the bootstrap are closely related: the bootstrap typically uses chain-ladder as its base model. The difference is that chain-ladder stops at the point estimate, while bootstrapping wraps a simulation layer around it to quantify uncertainty.
| Feature | Chain-Ladder | Bootstrap |
|---|---|---|
| Output | Single point estimate | Full reserve distribution |
| Uncertainty quantification | None (without extensions) | Built-in |
| Computational cost | Minimal | Moderate (thousands of iterations) |
| Flexibility | Limited to fixed assumptions | Can incorporate process variance, priors, adjustments |
| Regulatory use | Common for best estimate | Supports capital modeling and Solvency II requirements |
Assumptions and Sensitivities
Key assumptions underlying the standard bootstrap approach:
- Independence of residuals: residuals are assumed independent across cells of the triangle. Calendar-year effects (diagonal dependencies) violate this.
- Identical distribution: residuals are assumed to come from the same distribution. If volatility changes systematically across the triangle, this breaks down.
- Model adequacy: the base model (usually over-dispersed Poisson chain-ladder) must be a reasonable fit. Bootstrapping a misspecified model just gives you a precise distribution around the wrong answer.
Sensitivity testing should cover the number of bootstrap iterations (check convergence), the treatment of negative incremental values, the handling of outliers, and the choice of base model. Results can shift meaningfully depending on these choices, so documenting and justifying them is part of good actuarial practice.
Communicating Stochastic Results
Presenting Reserve Distributions
- Histograms or density plots show the full shape of the distribution, making skewness and tail behavior visible at a glance.
- Always report multiple summary statistics: mean, median, standard deviation, and key percentiles (75th, 90th, 95th, 99.5th).
- Confidence intervals (e.g., "there is a 90% probability that the reserve falls between and ") translate statistical output into language that supports decision-making.
Explaining Uncertainty to Stakeholders
Reserve uncertainty is not a sign of poor analysis; it's an inherent feature of insurance liabilities. When presenting results:
- Emphasize the range of outcomes rather than anchoring on a single number. The point estimate is the middle of a distribution, not a guarantee.
- Be transparent about what the model assumes and where those assumptions are weakest.
- Connect the numbers to decisions: "Holding reserves at the 75th percentile means we expect to be adequate 75% of the time. Moving to the 90th percentile costs million more but significantly reduces the risk of reserve shortfall."
- Tailor the level of technical detail to the audience. Board members need the implications; fellow actuaries need the methodology.