📊Actuarial Mathematics Unit 7 Review
7.4 Copulas and dependence structures
7.4 Copulas and dependence structures
Unit & Topic Study Guides
Probability Theory & Distributions
Stochastic Processes & Time Series
Financial Mathematics and Interest
Life Contingencies & Survival Models
Risk Theory and Insurance Models
Credibility Theory & Experience Rating
Loss Models & Severity Distributions
Ruin Theory & Surplus Processes
Actuarial reserving methods
Pension Math and Retirement Planning
Actuarial Modeling & Statistical Methods
Defining Copulas
A copula is a function that links marginal distributions together to form a joint distribution. The key idea: you can study each variable's individual behavior (its marginal) separately from how the variables relate to each other (the dependence structure). This separation gives actuaries far more flexibility when modeling things like correlated insurance claims, co-moving financial returns, or joint mortality rates.
Traditional correlation only captures linear relationships. Copulas go further by capturing nonlinear, asymmetric, and tail dependencies, which matters enormously when you're trying to price risk accurately.
Sklar's Theorem
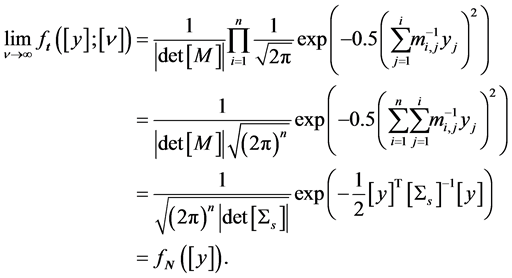
Sklar's theorem is the theoretical backbone of copula modeling. It states that any multivariate joint distribution can be written as:
where are the marginal CDFs and is the copula function.
This means you can:
- Model each marginal distribution on its own (pick whatever severity distribution fits best)
- Then choose a copula to glue them together with the right dependence structure
- Decompose any existing joint distribution into marginals + copula
If the marginals are continuous, the copula is unique. This uniqueness is what makes the decomposition so clean and useful.
Copula Properties
Every valid copula must satisfy several properties:
- Grounded: If any argument equals 0, the copula returns 0. (If one variable is at its minimum, the joint probability is zero.)
- Uniform margins: . When all other variables are set to their maximum, the copula reduces to the single remaining marginal.
- -increasing: The copula assigns non-negative probability to every hyperrectangle in .
- Invariance under monotone transforms: Copulas are invariant under strictly increasing transformations of the marginals. If you apply a monotone increasing function to a variable, the copula doesn't change. This is why rank-based measures pair naturally with copulas.
Fréchet-Hoeffding Bounds
These bounds define the most extreme dependence structures any copula can represent. For the bivariate case:
- Lower bound (countermonotonicity copula): , representing perfect negative dependence
- Upper bound (comonotonicity copula): , representing perfect positive dependence
Every valid bivariate copula satisfies for all .
Note: in dimensions , the lower bound is not itself a valid copula, though it still serves as a pointwise bound.
Dependence Structures
Copulas let you move beyond a single correlation number and think about dependence in richer ways. Three key concepts come up repeatedly: linear correlation, rank correlation, and tail dependence. Each captures a different aspect of how variables move together.
Linear Correlation
Pearson's correlation coefficient measures the strength and direction of the linear relationship between two variables, ranging from to .
Limitations you need to know:
- It only captures linear association. Two variables can have and still be strongly dependent (e.g., a quadratic relationship).
- It's sensitive to outliers.
- A given value of does not uniquely determine the copula. Different copulas can produce the same Pearson correlation while implying very different joint tail behavior.
- It implicitly works best under elliptical distributions. For skewed or heavy-tailed marginals, Pearson's can be misleading.
Rank Correlation
Rank correlations measure monotonic association using the ranks of observations rather than their raw values. Two standard measures:
- Spearman's : Pearson's correlation applied to the ranks. It equals the linear correlation of the copula itself (i.e., of the uniform-transformed variables).
- Kendall's : Based on concordant and discordant pairs. A pair and is concordant if both differences have the same sign.
Both are robust to outliers and invariant under strictly increasing transformations, which makes them natural companions to copula models. If you change the marginals but keep the copula, rank correlations stay the same. Pearson's generally does not.
Tail Dependence
Tail dependence measures whether extreme values tend to occur together. This is critical for actuarial risk assessment because catastrophic losses rarely happen in isolation.
- Upper tail dependence coefficient:
- Lower tail dependence coefficient:
A copula with exhibits upper tail dependence: when one variable takes an extremely high value, there's a non-vanishing probability the other does too. The same logic applies to for joint extreme lows.
Two variables can have the same Pearson or rank correlation but very different tail dependence. This is exactly why copula choice matters so much in practice.
Elliptical Copulas
Elliptical copulas are derived from elliptical distributions and produce symmetric, elliptically-contoured dependence structures. They're analytically tractable and widely used in finance and insurance.
Gaussian Copulas
The Gaussian copula is derived from the multivariate normal distribution. If is the standard normal CDF and is the multivariate normal CDF with correlation matrix :
Key characteristics:
- Parameterized by the correlation matrix
- Symmetric dependence structure
- No tail dependence ( for ). This is a major limitation: the Gaussian copula assumes that extreme events in one variable don't increase the probability of extremes in another.
- Simple to implement and widely used, but its lack of tail dependence was a recognized weakness in credit risk modeling, particularly during the 2007-2008 financial crisis.
t-Copulas
The t-copula is derived from the multivariate Student's t-distribution and adds a degrees of freedom parameter on top of the correlation matrix :
- Lower means heavier tails and stronger tail dependence
- As , the t-copula converges to the Gaussian copula
- Exhibits symmetric tail dependence: (for and )
- Better suited than the Gaussian copula for modeling scenarios where joint extremes are plausible, such as financial crises or catastrophic insurance events
The tail dependence coefficient for a bivariate t-copula is:
where is the CDF of a univariate t-distribution with degrees of freedom.
Estimating Parameters
Two main approaches for fitting elliptical copulas to data:
-
Maximum Likelihood Estimation (MLE): Estimate all parameters (marginals and copula) simultaneously by maximizing the full joint likelihood. This is statistically efficient but computationally intensive for complex models.
-
Inference Functions for Margins (IFM):
- Step 1: Estimate each marginal distribution's parameters separately.
- Step 2: Transform the data to uniform using the fitted marginals.
- Step 3: Estimate the copula parameters (correlation matrix, degrees of freedom) from the transformed data. IFM is computationally simpler and works well in practice, though it can be slightly less efficient than full MLE because estimation errors in step 1 propagate into step 2.
A third practical approach is canonical maximum likelihood (CML), where you skip parametric marginals entirely and use the empirical CDF (rank-transform) in step 1, then fit the copula in step 2. This avoids marginal misspecification.
Archimedean Copulas
Archimedean copulas are defined through a generator function and offer a flexible, parsimonious way to model dependence with just one or two parameters. They can capture asymmetric and tail dependence patterns that elliptical copulas cannot.
Generating Functions
An Archimedean copula takes the form:
where is the generator, a continuous strictly decreasing convex function with , and is its pseudo-inverse.
Different choices of produce different copula families, each with distinct dependence properties. The generator completely determines the copula's behavior.
Clayton Copulas
- Lower tail dependence:
- No upper tail dependence:
- As , the copula approaches independence; as , it approaches comonotonicity
- Use Clayton when you expect stronger dependence among small values (e.g., joint small claims, correlated credit defaults during downturns)
Gumbel Copulas
- Upper tail dependence:
- No lower tail dependence:
- At , you get independence; as , you approach comonotonicity
- Use Gumbel when you expect stronger dependence among large values (e.g., joint extreme financial losses, co-occurring catastrophic events)
Frank Copulas
- No tail dependence:
- Symmetric dependence structure
- Allows both positive dependence () and negative dependence ()
- Use Frank when you believe dependence is roughly symmetric and tail dependence is not a concern
Quick comparison: Clayton captures lower tail dependence, Gumbel captures upper tail dependence, and Frank captures neither. Choose based on where in the distribution you expect the strongest co-movement.
Copulas vs. Correlation
Understanding why copulas improve on simple correlation is important both conceptually and for exam purposes.
Limitations of Correlation
- Pearson's only captures linear dependence. Variables with strong nonlinear relationships can show .
- A single correlation number tells you nothing about tail behavior. Two joint distributions can share the same but have wildly different probabilities of joint extreme events.
- Pearson's is not invariant under nonlinear monotone transformations. Changing the marginals (e.g., from normal to lognormal) changes , even though the underlying dependence hasn't changed.
- Correlation matrices don't always correspond to valid joint distributions for non-elliptical marginals. Not every correlation matrix is attainable for arbitrary marginals.
Advantages of Copulas
- Separate marginal modeling from dependence modeling, so you can pick the best-fitting severity distribution for each risk independently
- Capture nonlinear, asymmetric, and tail dependence
- Rank correlations and tail dependence coefficients derived from copulas are invariant under monotone transforms
- Enable simulation of joint scenarios: generate dependent uniform random variables from the copula, then apply the inverse CDF of each marginal
- Support stress testing by changing the copula (or its parameters) while holding marginals fixed, letting you isolate the effect of dependence assumptions on risk measures like Value-at-Risk (VaR) and Expected Shortfall (ES)
Simulating from Copulas
Simulation is how copulas get used in practice. The general procedure:
- Generate dependent uniform random variables from the chosen copula
- Apply the inverse CDF (quantile function) of each marginal:
- The resulting follow the desired joint distribution with the specified marginals and dependence structure
Conditional Sampling
For Archimedean copulas, conditional sampling is a standard simulation method:
- Generate
- Generate
- Compute by inverting the conditional copula:
For the Clayton copula, the conditional distribution has a closed-form expression, making this inversion straightforward. For Gaussian and t-copulas, you can instead simulate from the underlying multivariate normal or t-distribution and then apply the probability integral transform.
This extends to higher dimensions by conditioning sequentially on previously generated variables.
Goodness-of-Fit Tests
After fitting a copula, you need to check whether it actually captures the observed dependence. Common approaches:
- Cramér-von Mises test: Measures the integrated squared difference between the empirical copula and the fitted parametric copula
- Kolmogorov-Smirnov test: Measures the maximum pointwise difference
- Anderson-Darling test: Similar to Cramér-von Mises but places more weight on the tails
These tests typically use parametric bootstrap procedures to obtain p-values, since the asymptotic distributions depend on the estimated parameters. A small p-value suggests the chosen copula family doesn't adequately fit the data.
Graphical diagnostics (e.g., comparing empirical and theoretical values of Kendall's , or QQ-plots of the copula) are also valuable complements to formal tests.
Applications of Copulas
Risk Aggregation
When an insurer holds multiple lines of business, the total risk depends on how those lines are correlated. Copulas let you:
- Model the joint distribution of losses across lines, capturing realistic dependence (not just linear correlation)
- Compute aggregate risk measures like VaR and ES for the combined portfolio
- Quantify diversification benefits: the difference between the sum of standalone risk measures and the aggregate risk measure. Stronger positive dependence means less diversification benefit.
- Allocate capital across business lines based on their contribution to aggregate risk
Portfolio Optimization
In asset management, copulas improve on classical mean-variance optimization by:
- Incorporating realistic tail dependence between asset returns (assets tend to become more correlated during market downturns)
- Allowing optimization with downside risk measures like Conditional Value-at-Risk (CVaR) instead of variance
- Producing portfolios that are more robust to extreme market events
Pricing Credit Derivatives
Copulas play a central role in credit risk modeling:
- CDO pricing: The copula models the joint default behavior of the underlying pool of borrowers. The choice of copula (and its tail dependence properties) directly affects tranche pricing. The Gaussian copula was the industry standard for CDO pricing, though its lack of tail dependence proved problematic.
- Credit default swaps (CDS): Copulas help model correlated default events in basket CDS products.
- Credit Value Adjustment (CVA): Copulas model the dependence between counterparty default and exposure, which is critical for accurate CVA calculation.
- Stress testing credit portfolios under different dependence assumptions helps assess how sensitive credit risk is to changes in correlation regimes.