🗺️World Geography Unit 1 Review
1.4 Spatial Thinking and Geographic Inquiry
1.4 Spatial Thinking and Geographic Inquiry
Unit & Topic Study Guides
Geography: Concepts, Tools, and Perspectives
Earth's Physical Systems: Land, Air, Water, Life
World Regions and Continents
North America: Geography, Climate & Ecosystems
North America: Culture, People, and Economy
Latin America: Geography, Climate & Ecosystems
Latin America: Culture, People, and Economy
Europe: Geography, Climate, and Ecosystems
Europe: Culture, People, and Economy
Africa: Geography, Climate, and Ecosystems
Africa: Culture, People, and Economy
Asia: Geography, Climate, and Ecosystems
Asia: Culture, Population, and Economy
Oceania: Geography, Climate & Ecosystems
Oceania: Culture, People, and Economy
Polar Regions
Urbanization and the Rise of Cities
Population Dynamics: Growth & Migration
Economic Geography: Resources & Development
Geopolitics: Global Borders and Conflicts
Globalization: Our Interconnected World
Environmental Challenges & Sustainability
GIS and Remote Sensing in Geography
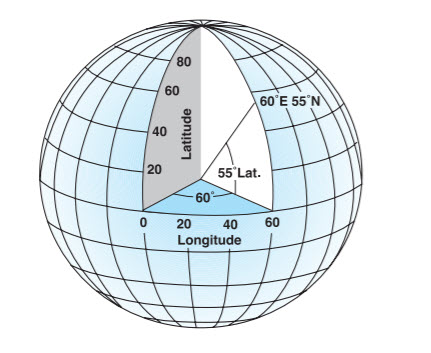
Spatial thinking skills
Spatial thinking is how geographers make sense of the world by analyzing relationships between places, patterns, and processes on Earth's surface. It's the foundation of geographic analysis, and it relies on a handful of core concepts you'll use constantly.
Spatial concepts and analysis
The building blocks of spatial thinking are concepts like location, distance, direction, scale, and region. These let you describe and compare spatial characteristics of different phenomena, such as how population density varies across a country or how land use patterns shift from urban cores to rural areas.
Once you can describe spatial characteristics, you can start identifying spatial patterns:
- Clustered distributions: features grouped close together (e.g., restaurants in a downtown area)
- Dispersed distributions: features spread far apart (e.g., farmsteads across the Great Plains)
- Random distributions: no predictable pattern
Techniques like nearest neighbor analysis, spatial autocorrelation, and hot spot analysis help you detect these patterns in data. Recognizing them often reveals underlying processes, like how urban sprawl follows transportation corridors or how disease outbreaks cluster around contaminated water sources.
Geographers also measure and model spatial relationships using tools like:
- Distance decay: the idea that interaction between two places decreases as the distance between them increases
- Gravity models: predict the flow of people, goods, or information between places based on their size and distance apart
- Network analysis: examines how connections (roads, trade routes, communication lines) link places together
These concepts help explain real-world flows, from commuter traffic patterns to international trade routes.
Geospatial technologies and visualization
Three major technologies power modern geographic analysis:
- Geographic Information Systems (GIS): software that layers, analyzes, and visualizes spatial data
- Global Positioning Systems (GPS): satellite-based systems that pinpoint exact locations on Earth's surface
- Remote sensing: collecting data about Earth from a distance, through satellite imagery or aerial photography
Together, these tools let geographers tackle complex questions, like mapping the spread of invasive species, tracking urban growth over decades, or monitoring deforestation rates in the Amazon.
Geovisualization takes this further by presenting geographic information in formats that are easier to explore and understand. Think 3D terrain models, animated maps showing change over time, or interactive maps you can click through. These aren't just flashy; they help users spot patterns and relationships that flat, static maps might hide.
Geographic inquiry methods
Geographic inquiry is a structured process for investigating spatial questions. It follows a clear sequence: ask geographic questions, collect and analyze data, then draw evidence-based conclusions.
Systematic approach to investigation
Geographic questions zero in on the spatial dimensions of a phenomenon. Three classic questions drive most inquiries:
- Where is it located?
- Why is it there?
- How is it related to other places?
These questions shape every step that follows. For example, investigating why a company chose a particular factory location leads you to gather data on transportation access, labor markets, and land costs. Analyzing the spatial pattern of crime in a city might require mapping incident reports and comparing them to socioeconomic data. The question determines the data and methods you need.
Data collection and analysis methods
Geographers draw on both primary data (information you collect yourself) and secondary data (information others have already gathered).
- Primary sources: field observations, surveys, interviews, direct measurements
- Secondary sources: existing maps, satellite imagery, census data, statistical databases
The scale of your study often determines which sources you lean on. A local-scale project, like studying soil erosion on a single hillside, might rely heavily on field measurements. A global-scale analysis of urbanization trends would draw more on remote sensing data and international databases.
Analysis methods fall into two broad categories:
- Quantitative methods: statistical analysis (regression, clustering), spatial analysis (overlay, buffer, interpolation)
- Qualitative methods: content analysis, coding interview transcripts, identifying themes in narratives
Fieldwork deserves special attention because it connects data to real places. Going into the field lets you collect firsthand observations, experience the landscape directly, and validate findings from other sources. A common example is ground-truthing, where you visit locations to verify what remote sensing data appears to show.
Geographic knowledge in decision-making
Geographic analysis isn't just academic. It directly supports decision-making in fields like urban planning, natural resource management, and disaster response.

Spatial decision support systems
Spatial decision support systems (SDSS) are computer-based tools that combine geographic data, analytical models, and visualization to help people make better decisions in a spatial context. A city planner might use an SDSS to evaluate where to zone new housing by layering flood risk data, transportation networks, and population projections, then comparing different scenarios side by side.
These systems can incorporate a wide range of inputs:
- Remote sensing and GIS data
- Simulation models and optimization algorithms
- Multi-criteria analysis (weighing competing priorities like cost, environmental impact, and equity)
- Collaborative tools like web-based platforms that let multiple stakeholders participate
Participatory mapping and ethical considerations
Participatory mapping involves local communities in creating and using maps. This approach can empower marginalized groups by making their knowledge visible, such as indigenous communities documenting traditional land boundaries or neighborhoods mapping environmental hazards that official data overlooks. It builds trust and improves communication between communities and decision-makers.
Geospatial analysis also supports evidence-based policy. For instance, mapping poverty concentrations can guide where to invest in urban renewal, or analyzing healthcare accessibility can reveal underserved areas that need new clinics.
With this power come ethical responsibilities:
- Privacy and confidentiality: geographic data can reveal sensitive information about individuals and communities
- Potential for misuse: location data can be used for surveillance or to reinforce existing inequalities
- Transparency and accountability: decision-making processes that use geographic data should be open to public scrutiny and participation
Geographers have a responsibility to use spatial data in ways that are socially and environmentally responsible.
Communicating geographic information
Cartography and map design
Cartography is the art and science of making maps, and it's one of the primary ways geographic information reaches an audience. A well-designed map communicates spatial data accurately and clearly; a poorly designed one misleads.
Different map types suit different kinds of data:
- Choropleth maps shade areas to represent data values (population density by county, income levels by state)
- Proportional symbol maps use differently sized symbols at point locations (circles scaled to city population or earthquake magnitude)
- Line symbols represent linear features like roads, rivers, or migration routes
Every effective map follows core design principles:
- Choose an appropriate map projection and scale for your purpose
- Use legible fonts and clear labeling
- Include a legend, scale bar, and north arrow
- Maintain visual hierarchy so the most important information stands out
Web-based mapping and storytelling
Web-based platforms like Google Maps, OpenStreetMap, and ArcGIS Online have made map creation and sharing far more accessible. Anyone can contribute geographic data, which has opened the door to citizen science projects and community-based monitoring efforts through what's called volunteered geographic information (VGI).
Story maps take this a step further by combining maps with text, images, video, and audio to build narratives about places and phenomena. Tools like Esri Story Maps, Mapbox, and Carto let you create interactive experiences where users can scroll, zoom, and click to explore. This format is especially effective for engaging audiences who aren't GIS specialists, whether that's an interactive historical narrative or a visual report on environmental change.
When creating any geographic visualization, apply solid data visualization principles:
- Choose chart types that match your data (bar charts for comparisons, line graphs for trends, scatter plots for relationships)
- Use consistent scales and units
- Provide clear labels and legends
- Highlight key patterns like outliers, clusters, or correlations
- Design for accessibility, including color-blind-friendly palettes and screen-reader compatibility