Confidence Intervals for Regression Coefficients
Calculation and Formula
Confidence intervals give you a range of plausible values for a true population parameter (like ), rather than relying on a single point estimate. They're built from three ingredients: the coefficient estimate, its standard error, and a critical value from the t-distribution.
The general formula:
where:
- is the estimated coefficient
- is the critical value from the t-distribution with degrees of freedom at significance level
- is the standard error of the coefficient estimate
- is the sample size and is the number of parameters in the model (including the intercept)
To construct a confidence interval step by step:
-
Obtain and from your regression output.
-
Determine the confidence level you want (e.g., 95%) and compute (e.g., 0.025).
-
Look up or compute from the t-distribution with degrees of freedom.
-
Multiply: to get the margin of error.
-
Form the interval: to .
Standard Error and Significance Testing
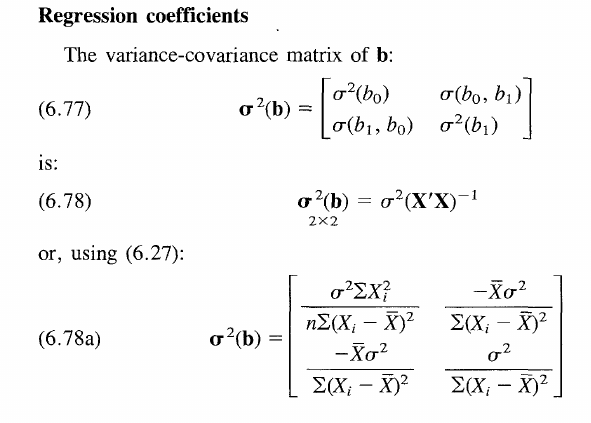
The standard error of a regression coefficient comes from the variance-covariance matrix of the coefficient estimates. Specifically, is the square root of the th diagonal element of that matrix.
Confidence intervals double as a significance test for individual predictors:
- If the interval does not contain zero, the predictor is statistically significant at the chosen level.
- If the interval does contain zero, you cannot conclude the predictor has a significant linear relationship with the response.
Example: Suppose a 95% confidence interval for the coefficient of is . Because zero falls outside this interval, is a significant predictor at the 0.05 significance level.
Interpreting Confidence Intervals
Meaning and Interpretation
A confidence interval for a regression coefficient provides a range of values that are plausible for the true population parameter, given the observed data and the chosen confidence level.
The correct frequentist interpretation: if the model assumptions hold and you repeated the sampling process many times, approximately 95% of the resulting 95% confidence intervals would contain the true parameter value. Any single interval either contains the true value or it doesn't; the "95%" refers to the long-run coverage rate of the procedure, not the probability that this particular interval captured the truth.
A narrow interval indicates a more precise estimate. A wide interval signals greater uncertainty, often due to high variability in the data or a small sample size.
Statistical Significance and Holding Other Predictors Constant
In multiple regression, each coefficient represents the expected change in the response for a one-unit increase in that predictor, holding all other predictors constant. The confidence interval inherits this "all else equal" interpretation.
- If the interval excludes zero, the predictor has a statistically significant relationship with the response after controlling for the other variables in the model.
- The interval itself tells you the range of plausible effect sizes, which is often more informative than a simple "significant or not" verdict.
Example: A 99% confidence interval for the coefficient of is . This means that, controlling for other predictors, a one-unit increase in is associated with somewhere between a 2.1 and 4.7 unit increase in the response. Because zero is excluded, the relationship is significant at the 0.01 level.
Confidence Levels for Model Parameters
Choosing Confidence Levels
The confidence level is the long-run proportion of intervals that will contain the true parameter when the procedure is repeated. Common choices and their corresponding significance levels:
| Confidence Level | Significance Level () |
|---|---|
| 90% | 0.10 |
| 95% | 0.05 |
| 99% | 0.01 |
The choice comes down to a trade-off:
- Higher confidence levels (e.g., 99%) produce wider intervals. You're more confident the true value is captured, but the range of plausible values is less precise.
- Lower confidence levels (e.g., 90%) produce narrower intervals that are more informative, but you accept a higher risk that the interval misses the true parameter.
Trade-offs and Considerations
Selecting a confidence level also means balancing two types of error:
- Type I error (false positive): Concluding a predictor is significant when it truly isn't. A higher confidence level reduces this risk.
- Type II error (false negative): Failing to detect a real relationship. Higher confidence levels (wider intervals) make it harder to exclude zero, increasing this risk.
Conventions vary by discipline. In social sciences, 95% is standard. In particle physics, researchers often require a 5-sigma threshold (roughly 99.99997% confidence) before claiming a discovery. Always report your chosen confidence level so readers can judge the precision and reliability of your results.
Precision of Estimates vs. Interval Width
Factors Affecting Interval Width
The width of a confidence interval directly reflects how precisely you've estimated the coefficient. Narrower intervals mean more precision. Several factors drive the width:
- Standard error of the coefficient: Smaller standard errors produce narrower intervals. The standard error itself depends on:
- Sample size (): Larger samples reduce the standard error, narrowing the interval.
- Variability in the data: More scatter in the response around the regression line inflates the standard error.
- Spread of the predictor values: Greater variability in actually helps, because it gives you more information about the slope, reducing .
- Confidence level: Higher confidence levels require larger critical values, widening the interval.
- Degrees of freedom (): More degrees of freedom push the t-distribution closer to the normal distribution, slightly shrinking the critical value. Adding more predictors (increasing ) reduces degrees of freedom and can widen intervals.
Comparing Precision and Model Selection
Comparing interval widths across models or predictors can inform both model selection and variable importance.
Example: Two models predict the same response. Model A's coefficient intervals are noticeably narrower than Model B's. This suggests Model A provides more precise estimates of the predictor-response relationships.
That said, precision alone shouldn't drive model choice. You should also weigh:
- Interpretability: A slightly less precise model may be easier to explain and use.
- Parsimony: Fewer predictors means fewer parameters to estimate and less risk of overfitting.
- Assumption adherence: A model that better satisfies regression assumptions (linearity, constant variance, normality of errors) will produce more trustworthy intervals regardless of their width.
Within a single model, predictors with narrow intervals that exclude zero are the most reliably important. Predictors with wide intervals, especially those that include zero, contribute less certain information about the response.