💊Pharmacology for Nurses Unit 16 Review
16.3 Conduction of Electrical Impulses
16.3 Conduction of Electrical Impulses
Unit & Topic Study Guides
Introduction to Pharmacology
Drug Administration
Ethics and Safety in Pharmacology
Introduction to Homeostasis
Fluids, Electrolytes, Vitamins, and Minerals
Immune System and Inflammation Basics
Anti–infective Drugs
Cancer Therapy: Intro to Drugs and Treatment
Nervous System Basics for Nurses
Myasthenia Gravis & Alzheimer's Medications
Parkinson's and MS Drug Treatments
Anticonvulsants and Neurological Treatments
Psychopharmacologic Drugs
Pain Response Drugs
Substance Use Disorder Treatment Medications
Cardiovascular System Basics
Antidysrhythmic Drugs
Hypertension & Angina Medications
Heart Failure Drugs
Anticoagulants and Antiplatelets in Nursing
Lipid–Lowering Drugs
Cardiac Emergency and Shock Drugs
Respiratory System Basics for Nurses
Upper Respiratory Disorder Drugs
Lower Respiratory Disorder Drugs
Hypothalamic, Pituitary & Adrenal Drug Therapy
Thyroid & Parathyroid Medication
Diabetic Drugs
Digestive System Basics for Nurses
Gastrointestinal Disorder Drugs
Hyperacidity and Antiulcer Drugs
Weight Management Drugs
Renal and Urinary Systems Overview
Diuretic Drugs
Drugs for Urinary & Bladder Disorders
Reproductive Health Drugs
Transgender and Nonbinary Drugs
Ophthalmic Drugs
Otic Drugs
Cardiac Electrical Conduction System
The heart's electrical conduction system controls the timing and sequence of every heartbeat. Each structure in the system fires in a specific order, creating the coordinated contraction that pumps blood effectively. For nurses, understanding this system is the foundation for interpreting ECGs, recognizing arrhythmias, and understanding how many cardiac drugs work.
Cardiac muscle has unique properties that make this possible. Unlike skeletal muscle, cardiac cells can generate their own electrical impulses (automaticity), pass those impulses rapidly to neighboring cells (conductivity), and contract in response (contractility). These properties, combined with the ECG's ability to visualize electrical activity on paper, form the basis for diagnosing and treating cardiovascular disorders.
Components of the Cardiac Conduction System
The conduction system is a chain of specialized cardiac cells that generate and transmit electrical impulses in a precise sequence. Each component has a built-in firing rate, which matters clinically because if one part fails, the next one down the chain can take over as a backup pacemaker.
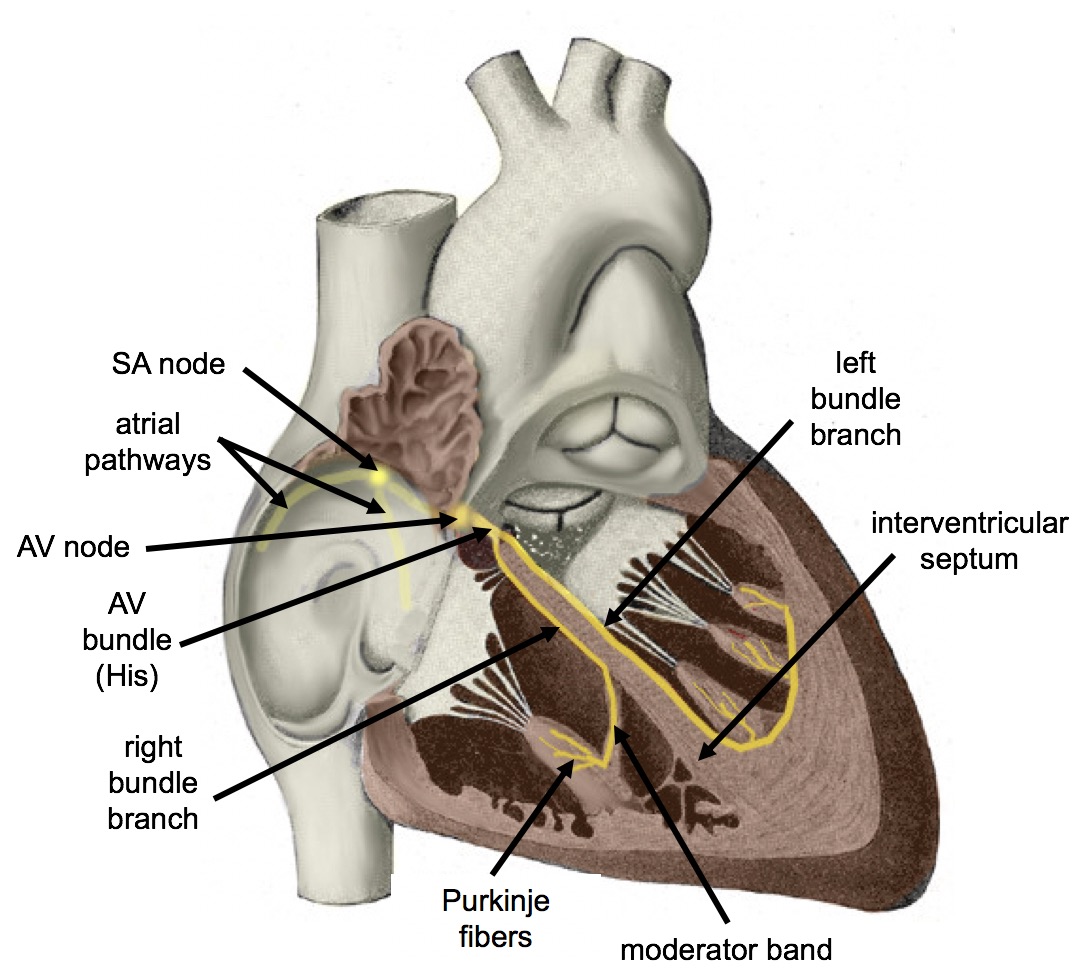
- Sinoatrial (SA) node: Located in the wall of the right atrium, this is the heart's natural pacemaker. It generates impulses at 60–100 beats per minute, setting the pace for normal sinus rhythm.
- Atrioventricular (AV) node: Sits between the atria and ventricles. Its key job is to delay impulse transmission by about 0.1 seconds. That brief pause gives the atria time to finish contracting and emptying blood into the ventricles before the ventricles fire.
- Bundle of His: Conducts impulses from the AV node into the ventricles. It divides into the left and right bundle branches, which carry the signal to their respective ventricles.
- Purkinje fibers: The terminal branches of the conduction system. These fibers rapidly spread the impulse throughout the ventricular walls, triggering a coordinated contraction that moves from the apex (bottom) upward toward the base. This bottom-to-top pattern is what efficiently ejects blood out through the aorta and pulmonary artery.
The full conduction pathway, step by step:
- The SA node generates an electrical impulse.
- The impulse spreads across both atria, causing atrial depolarization and contraction.
- The AV node receives the impulse and delays it ~0.1 seconds.
- The impulse travels down the Bundle of His.
- It splits into the left and right bundle branches.
- Purkinje fibers distribute the impulse rapidly throughout the ventricles.
- The ventricles depolarize and contract.
Electrical Impulse Generation and Propagation
Each heartbeat starts with an action potential, a rapid change in the electrical charge across a cardiac cell's membrane. Here's how it works at the cellular level:
- Resting state: The cell membrane is polarized (negative inside relative to outside).
- Depolarization: When the cell reaches its threshold potential (the minimum voltage needed to trigger firing), sodium channels open rapidly and sodium ions rush into the cell. This flips the charge inside the cell to positive.
- Repolarization: Potassium channels open more slowly, allowing potassium ions to flow out of the cell. This restores the negative resting charge.
Two additional concepts are clinically important:
- Refractory period: After firing, a cardiac cell temporarily cannot be re-excited. This prevents the impulse from traveling backward and ensures it moves in one direction through the heart. It also protects against dangerously rapid re-stimulation.
- Pacemaker potential: Cells in the SA node (and to a lesser degree, the AV node and Purkinje fibers) don't just sit at a stable resting potential. They slowly and spontaneously depolarize on their own until they reach threshold and fire. This is what makes the heart self-generating; it doesn't need a signal from the brain to beat.
Cardiac Muscle Function
Properties of Cardiac Muscle
Three properties make cardiac muscle uniquely suited to its job. These come up repeatedly in pharmacology because many cardiac drugs target one or more of them directly.
- Automaticity: Cardiac cells can spontaneously generate electrical impulses without any external stimulation. The SA node has the highest intrinsic rate (60–100 bpm), so it normally controls the rhythm. If the SA node fails, the AV node can take over at 40–60 bpm. If both fail, Purkinje fibers can fire at 20–40 bpm. These backup rates are slower, which is why patients with conduction blocks often present with bradycardia.
- Conductivity: Electrical impulses travel rapidly from cell to cell through gap junctions, which are direct connections between adjacent cardiac cells. This allows the atria to contract together as a unit, and then the ventricles to contract together as a unit, rather than individual cells firing randomly.
- Contractility: This is the actual force of the heart's contraction in response to electrical stimulation. Contractility depends on calcium ions () for excitation-contraction coupling. Sympathetic stimulation (think fight-or-flight) increases contractility, while parasympathetic stimulation (rest-and-digest) decreases it. Many drugs you'll study, such as digoxin and dobutamine, work by increasing contractility.

Electrocardiogram (ECG) Interpretation
ECG Waves, Intervals, and What They Represent
The ECG is a recording of the heart's electrical activity over time. Each wave and interval corresponds to a specific electrical event. Knowing what's normal lets you spot what's abnormal.
Waves:
- P wave: Represents atrial depolarization (the electrical signal spreading across the atria). It appears just before the atria contract. In lead II, a normal P wave is upright and rounded.
- QRS complex: Represents ventricular depolarization. It appears just before the ventricles contract. The complex has three parts: the Q wave (initial downward deflection), the R wave (first upward deflection), and the S wave (downward deflection after the R wave). A normal QRS is narrow, lasting 0.06–0.10 seconds.
- T wave: Represents ventricular repolarization (the ventricles resetting their electrical charge after contraction). Normally upright and rounded in lead II.
Note: You won't see a separate wave for atrial repolarization on the ECG. It happens during the QRS complex and is hidden by the much larger ventricular signal.
Intervals:
- PR interval: Measured from the start of the P wave to the start of the QRS complex. It reflects the time it takes for the impulse to travel from the SA node through the AV node to the ventricles. Normal duration is 0.12–0.20 seconds. A prolonged PR interval suggests an AV conduction delay (first-degree heart block).
- QT interval: Measured from the start of the QRS complex to the end of the T wave. It represents the total time for ventricular depolarization and repolarization. Normal duration is approximately 0.36–0.44 seconds, though it varies with heart rate. A prolonged QT interval is clinically significant because it increases the risk of dangerous arrhythmias like torsades de pointes. Several medications can prolong the QT interval, making this a key monitoring parameter in pharmacology.
Heart rate calculation:
The R-R interval is the time between two consecutive R waves. For example, if the R-R interval is 0.75 seconds:
Normal resting heart rate is 60–100 bpm. Below 60 is bradycardia; above 100 is tachycardia.