Lead compensator design
Lead compensators improve the transient response and stability margins of a control system by introducing phase lead into the frequency response. The general transfer function of a lead compensator takes the form:
The zero sits closer to the origin than the pole. This arrangement produces a net positive phase shift over a range of frequencies, which is exactly what you need to boost phase margin.
Improving transient response
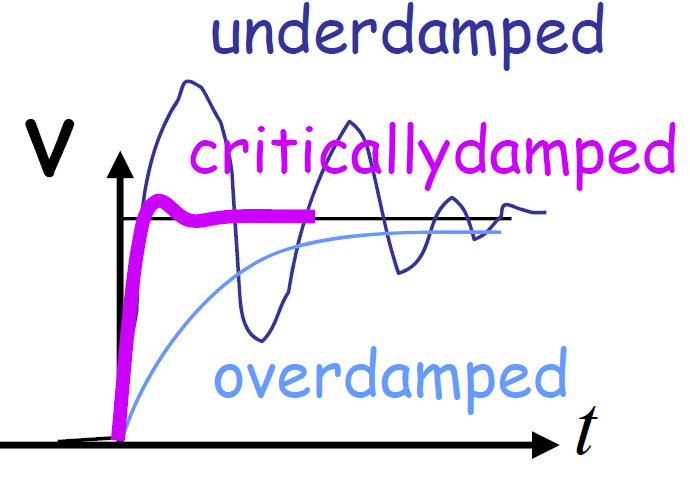
Adding phase lead increases the effective damping ratio of the closed-loop system. The practical result: less overshoot and shorter settling time in the step response.
- The extra phase margin allows you to push the gain crossover frequency higher, which speeds up the system's response.
- A higher damping ratio directly reduces peak overshoot. For example, a well-placed lead compensator can bring overshoot down from 30% to 10% on a second-order plant.
- The settling time drops because the dominant poles move further into the left half of the s-plane.
Increasing phase margin
The maximum phase lead from a single lead compensator occurs at the geometric mean of the zero and pole frequencies:
At that frequency, the phase contribution is:
where for a lead network. A single lead stage can typically add up to about 60° of phase. If you need more, you can cascade two lead stages, though this amplifies high-frequency gain.
A system with only 30° of phase margin is fragile. Boosting it to 50–60° with a lead compensator makes the system much more tolerant of parameter variations and modeling errors.
Gain crossover frequency effects
Because the lead compensator adds gain at mid-to-high frequencies, the gain crossover frequency shifts upward. This increases bandwidth and makes the system respond faster to commands and reject disturbances more quickly.
The trade-off: pushing too high amplifies sensor noise and can saturate actuators. You need to pick a crossover frequency that balances speed against noise sensitivity. A good rule of thumb is to place of the lead compensator at or near the desired new .
Lag compensator design
Lag compensators improve steady-state accuracy by boosting low-frequency gain without significantly affecting the transient response. The general transfer function is:
Here the pole is closer to the origin than the zero. This is the opposite arrangement from a lead compensator.
Improving steady-state error
A lag compensator raises the DC gain (or low-frequency gain) of the open-loop system. Higher low-frequency gain directly reduces steady-state error to step, ramp, or constant disturbance inputs.
- The ratio determines how much the low-frequency gain increases. For example, if , the DC gain rises by 20 dB.
- A system with 10% steady-state error can be brought down to about 1% with a properly designed lag compensator.
- The lag section acts somewhat like an integrator at low frequencies, though it doesn't place a pole exactly at the origin (so it won't eliminate steady-state error to a ramp the way a true integrator would).
Decreasing gain crossover frequency
Because the lag compensator attenuates gain at higher frequencies, the gain crossover frequency shifts downward. A lower means:
- Reduced sensitivity to high-frequency noise and unmodeled dynamics
- Potentially slower transient response (the system bandwidth shrinks)
For instance, a lag compensator might move from 10 rad/s down to 3 rad/s. The system becomes more robust but responds more slowly.
Phase margin considerations
The lag compensator introduces negative phase shift, which can erode phase margin if you're not careful. To minimize this problem:
- Place the lag pole and zero well below the gain crossover frequency (typically a factor of 5–10 below ).
- This ensures the negative phase contribution at is small, usually only 5–10°.
- Aim for a final phase margin of at least 45° after adding the lag section.
The maximum phase lag occurs at , so keeping both the pole and zero at low frequencies pushes that peak lag away from the crossover region.
Lead-lag compensator design
A lead-lag compensator combines both sections into one transfer function:
where the first factor is the lead section () and the second is the lag section (). This gives you simultaneous control over transient response and steady-state accuracy.
Combining lead and lag
The two sections operate in different frequency ranges and can be designed mostly independently:
- The lead section works around the gain crossover frequency, adding phase margin and increasing bandwidth.
- The lag section works at low frequencies, boosting DC gain to reduce steady-state error.
- The overall phase contribution is the sum of both sections. As long as the lag pole/zero are placed well below , the lag section won't interfere much with the phase margin improvements from the lead section.
Improving transient and steady-state
With a lead-lag compensator, you can target multiple specs at once. For example, you might design for:
- Overshoot ≤ 5% (handled by the lead section's phase margin boost)
- Settling time ≤ 1 second (handled by the lead section's crossover frequency increase)
- Steady-state error ≤ 2% (handled by the lag section's low-frequency gain boost)
The designer must check that the two sections don't conflict. If the lag section's phase contribution at is too large, it can undo the lead section's work.

Design process and steps
- Set performance specs: Define targets for overshoot, settling time, steady-state error, and stability margins.
- Design the lead section first. Determine how much additional phase margin is needed at the desired . Place the lead zero and pole to provide that phase at .
- Design the lag section. Calculate how much additional low-frequency gain is needed to meet the steady-state error spec. Choose the lag zero/pole ratio accordingly, and place both well below .
- Combine the lead and lag transfer functions and include any necessary gain .
- Verify using Bode plots: check gain margin (≥ 6 dB), phase margin (≥ 45°), bandwidth, and steady-state error.
- Iterate if any spec is not met. Adjust pole/zero locations or gain as needed.
Bode plot analysis
Bode plots display the frequency response of a transfer function as two separate graphs: magnitude (in dB) and phase (in degrees), both plotted against frequency on a logarithmic scale. They're the primary tool for frequency-domain compensator design.
Gain vs phase plots
- The magnitude plot shows in dB. Where this plot crosses 0 dB, the system has unity gain; that frequency is the gain crossover frequency .
- The phase plot shows in degrees. Where this plot crosses , that frequency is the phase crossover frequency .
- Phase margin = phase at minus . Positive phase margin means the closed-loop system is stable.
- Gain margin = 0 dB minus the magnitude at . A positive gain margin (in dB) also indicates stability.
Compensator transfer functions
Each compensator type has a distinct Bode signature:
- Lead compensator: The magnitude plot rises with a +20 dB/decade slope between the zero and pole frequencies. The phase plot shows a positive hump, peaking at . For example, a lead compensator with a zero at 10 rad/s and a pole at 100 rad/s produces a maximum phase lead of about 55° at 31.6 rad/s.
- Lag compensator: The magnitude plot drops with a −20 dB/decade slope between the pole and zero frequencies. The phase plot shows a negative dip in the same region.
- Lead-lag compensator: The Bode plot combines both signatures. You'll see the lag section's gain boost at low frequencies and the lead section's phase boost near .
Stability and performance metrics
From a Bode plot, you can read off several key quantities:
| Metric | How to find it | Typical target |
|---|---|---|
| Gain margin | Magnitude below 0 dB at | ≥ 6 dB |
| Phase margin | Phase above at | ≥ 45° |
| Bandwidth | Frequency where closed-loop magnitude drops to dB | Depends on speed spec |
| Peak magnitude | Maximum of closed-loop magnitude plot | Lower means less resonance/overshoot |
A system that meets both the gain margin and phase margin targets is considered robustly stable.
Root locus techniques
Root locus plots show how the closed-loop poles move in the s-plane as a parameter (usually loop gain ) varies from 0 to . Adding compensator poles and zeros reshapes these trajectories, giving you direct control over where the closed-loop poles end up.
Poles and zeros of compensators
When you add a compensator to the open-loop transfer function, its poles and zeros change the root locus geometry:
- A lead compensator adds a zero-pole pair with the zero closer to the origin. The zero "pulls" nearby root locus branches to the left (toward more negative real parts), increasing damping.
- A lag compensator adds a pole-zero pair with the pole closer to the origin. This pair is placed near the origin and has a small effect on the dominant pole locations, but it changes the gain needed to reach a particular point on the locus.
- A lead-lag compensator adds both pairs. The lead zero/pole reshape the dominant branches, while the lag pole/zero fine-tune the gain.
Root locus design process
- Determine the desired dominant closed-loop pole locations from your transient response specs (damping ratio , natural frequency ).
- Plot the root locus of the uncompensated system and check whether the desired pole locations lie on it.
- If they don't, calculate the angle deficiency at the desired pole location. This tells you how much phase the compensator must contribute.
- Place the compensator zero and pole so that the net angle contribution at the desired location makes up the deficiency.
- Find the gain at the desired pole location using the magnitude condition.
- Verify the design by checking all closed-loop poles (not just the dominant ones) and simulating the step response.
Dominant pole placement
The dominant poles are the closed-loop poles closest to the imaginary axis. They have the slowest decay and therefore dominate the transient response.
- For a second-order-like response, you typically target a damping ratio of 0.5–0.7 and choose to satisfy the settling time requirement: (for 2% criterion).
- Non-dominant poles should be at least 5–10 times further left than the dominant poles so their effect decays quickly.
- If the compensator introduces additional closed-loop poles that aren't far enough left, the actual response will differ from the second-order approximation. Always simulate to confirm.
Frequency response methods
Beyond Bode plots, two other frequency-domain tools are commonly used for compensator analysis: Nyquist diagrams and Nichols charts. Each presents the same information in a different format that can be more convenient for certain tasks.
Nichols chart usage
A Nichols chart plots the open-loop magnitude (dB) on the vertical axis against the open-loop phase (degrees) on the horizontal axis. Each point on the curve corresponds to a particular frequency.
The main advantage: you can read both open-loop and closed-loop information from the same plot. Overlaid on the chart are M-circles and N-circles that map open-loop data to closed-loop magnitude and phase.
- The critical point sits at (, 0 dB). The distance from the open-loop curve to this point tells you the gain and phase margins directly.
- If the open-loop curve passes through the critical point, the system is marginally stable.
M-circles on Nichols chart
M-circles are contours of constant closed-loop magnitude . On the Nichols chart, they appear as closed curves surrounding the critical point.
- The 0 dB M-circle passes through the critical point.
- Larger M-values (e.g., +3 dB, +6 dB) correspond to smaller circles closer to the critical point.
- If the open-loop curve is tangent to the +3 dB M-circle, the closed-loop system has a peak magnitude of 3 dB. A lower generally means less overshoot in the time domain.
To use M-circles for design: reshape the open-loop curve (by adjusting compensator parameters) so that it doesn't penetrate M-circles beyond your acceptable spec.
N-circles on Nichols chart
N-circles are contours of constant closed-loop phase . On the Nichols chart, they appear as curves that pass through the critical point.
- The N-circle is a vertical line through the critical point.
- Other N-circles curve away from this line, each representing a different closed-loop phase value.
- By tracing where the open-loop curve crosses different N-circles, you can reconstruct the closed-loop phase response without computing explicitly.
Together, M-circles and N-circles let you extract the full closed-loop frequency response graphically from the open-loop Nichols plot.
PID vs lead-lag
PID controllers and lead-lag compensators are both widely used, and they share structural similarities. Understanding when to use each one matters for practical design.
Similarities and differences
Both PID and lead-lag compensators add poles and zeros to shape the open-loop transfer function. The key structural difference:
- A PID controller has the form , which includes a pole at the origin (from the integral term) and a zero from each of the PI and PD combinations.
- A lead-lag compensator has finite poles and zeros only. There's no pole at the origin, so it doesn't provide true integral action.
Because PID has a pure integrator, it can drive steady-state error to zero for step inputs (Type 1 behavior). A lag compensator reduces steady-state error but doesn't eliminate it entirely unless the plant already has an integrator.
Advantages and disadvantages
| PID | Lead-Lag | |
|---|---|---|
| Tuning | Simple rules exist (Ziegler-Nichols, etc.) | Requires more system knowledge |
| Steady-state error | Eliminated by integral action | Reduced but not eliminated (without plant integrator) |
| Noise sensitivity | Derivative term amplifies noise | Lead section amplifies noise, but can be shaped more precisely |
| Common issues | Integral windup, derivative kick | High-frequency gain from lead section |
| Typical use | Process control (temperature, flow, level) | Motion control, aerospace, servos |
PID controllers are the default choice when the plant dynamics are not well known and simple tuning is preferred. Lead-lag compensators offer more precise frequency-domain shaping when you have a good plant model and need tighter performance.
Applications and use cases
- PID: Chemical reactors, HVAC systems, flow control, level control. These processes tend to be slow, and the simple three-parameter structure of PID is sufficient.
- Lead-lag: Spacecraft attitude control, robotic arm positioning, high-bandwidth servo drives. These applications demand precise transient behavior and have well-characterized dynamics.
- Many real systems use a hybrid approach: a PID core with additional lead or lag filtering to handle specific frequency-domain requirements.
Digital implementation
Most modern controllers run on digital hardware (microcontrollers, DSPs), so continuous-time compensator designs must be converted to discrete-time equivalents before implementation.
Discrete-time compensators
A continuous-time compensator becomes a discrete-time compensator through a discretization method. The z-domain transfer function operates on sampled signals with sampling period .
- Poles and zeros move from the s-plane to the z-plane. A stable continuous-time pole at maps approximately to .
- The sampling rate must be fast enough to capture the system dynamics. A common guideline: the sampling frequency should be at least 10–20 times the closed-loop bandwidth.
Bilinear transform method
The bilinear transform (also called the Tustin method) is the most common discretization approach. It substitutes:
into the continuous-time transfer function to obtain .
Why it works well:
- It maps the entire left half of the s-plane to the interior of the unit circle in the z-plane. A stable continuous design stays stable after discretization.
- It preserves the frequency response shape, though frequencies get "warped." The relationship between the continuous frequency and the discrete frequency is:
Frequency pre-warping: If you need the discrete compensator to match the continuous design exactly at a specific critical frequency (like ), you can pre-warp by choosing an adjusted in the substitution formula so that the critical frequency maps correctly.
Tustin approximation
The Tustin approximation is another name for the bilinear transform. The name comes from its equivalence to the trapezoidal rule for numerical integration. When you discretize an integrator using the bilinear transform, you get:
This corresponds to approximating the integral of a signal using trapezoids rather than rectangles (as in forward or backward Euler methods). The trapezoidal approximation is more accurate than Euler methods for the same sampling rate, which is why the bilinear transform is generally preferred for compensator discretization.
Other discretization methods (matched pole-zero, forward Euler, backward Euler, zero-order hold) exist and may be preferred in specific situations, but the bilinear/Tustin method is the standard starting point for lead-lag compensator implementation.