AP Statistics Unit 1 Cheatsheet: Exploring One-Variable Data and Collecting Data

AP Statistics Unit 1 Cheatsheet: Exploring One-Variable Data and Collecting Data

Start with the first 3 sections of the Unit 1 one-page cheatsheet below. The full sheet is a PDF you can print.

Statistical Study Fundamentals

Population vs. Sample

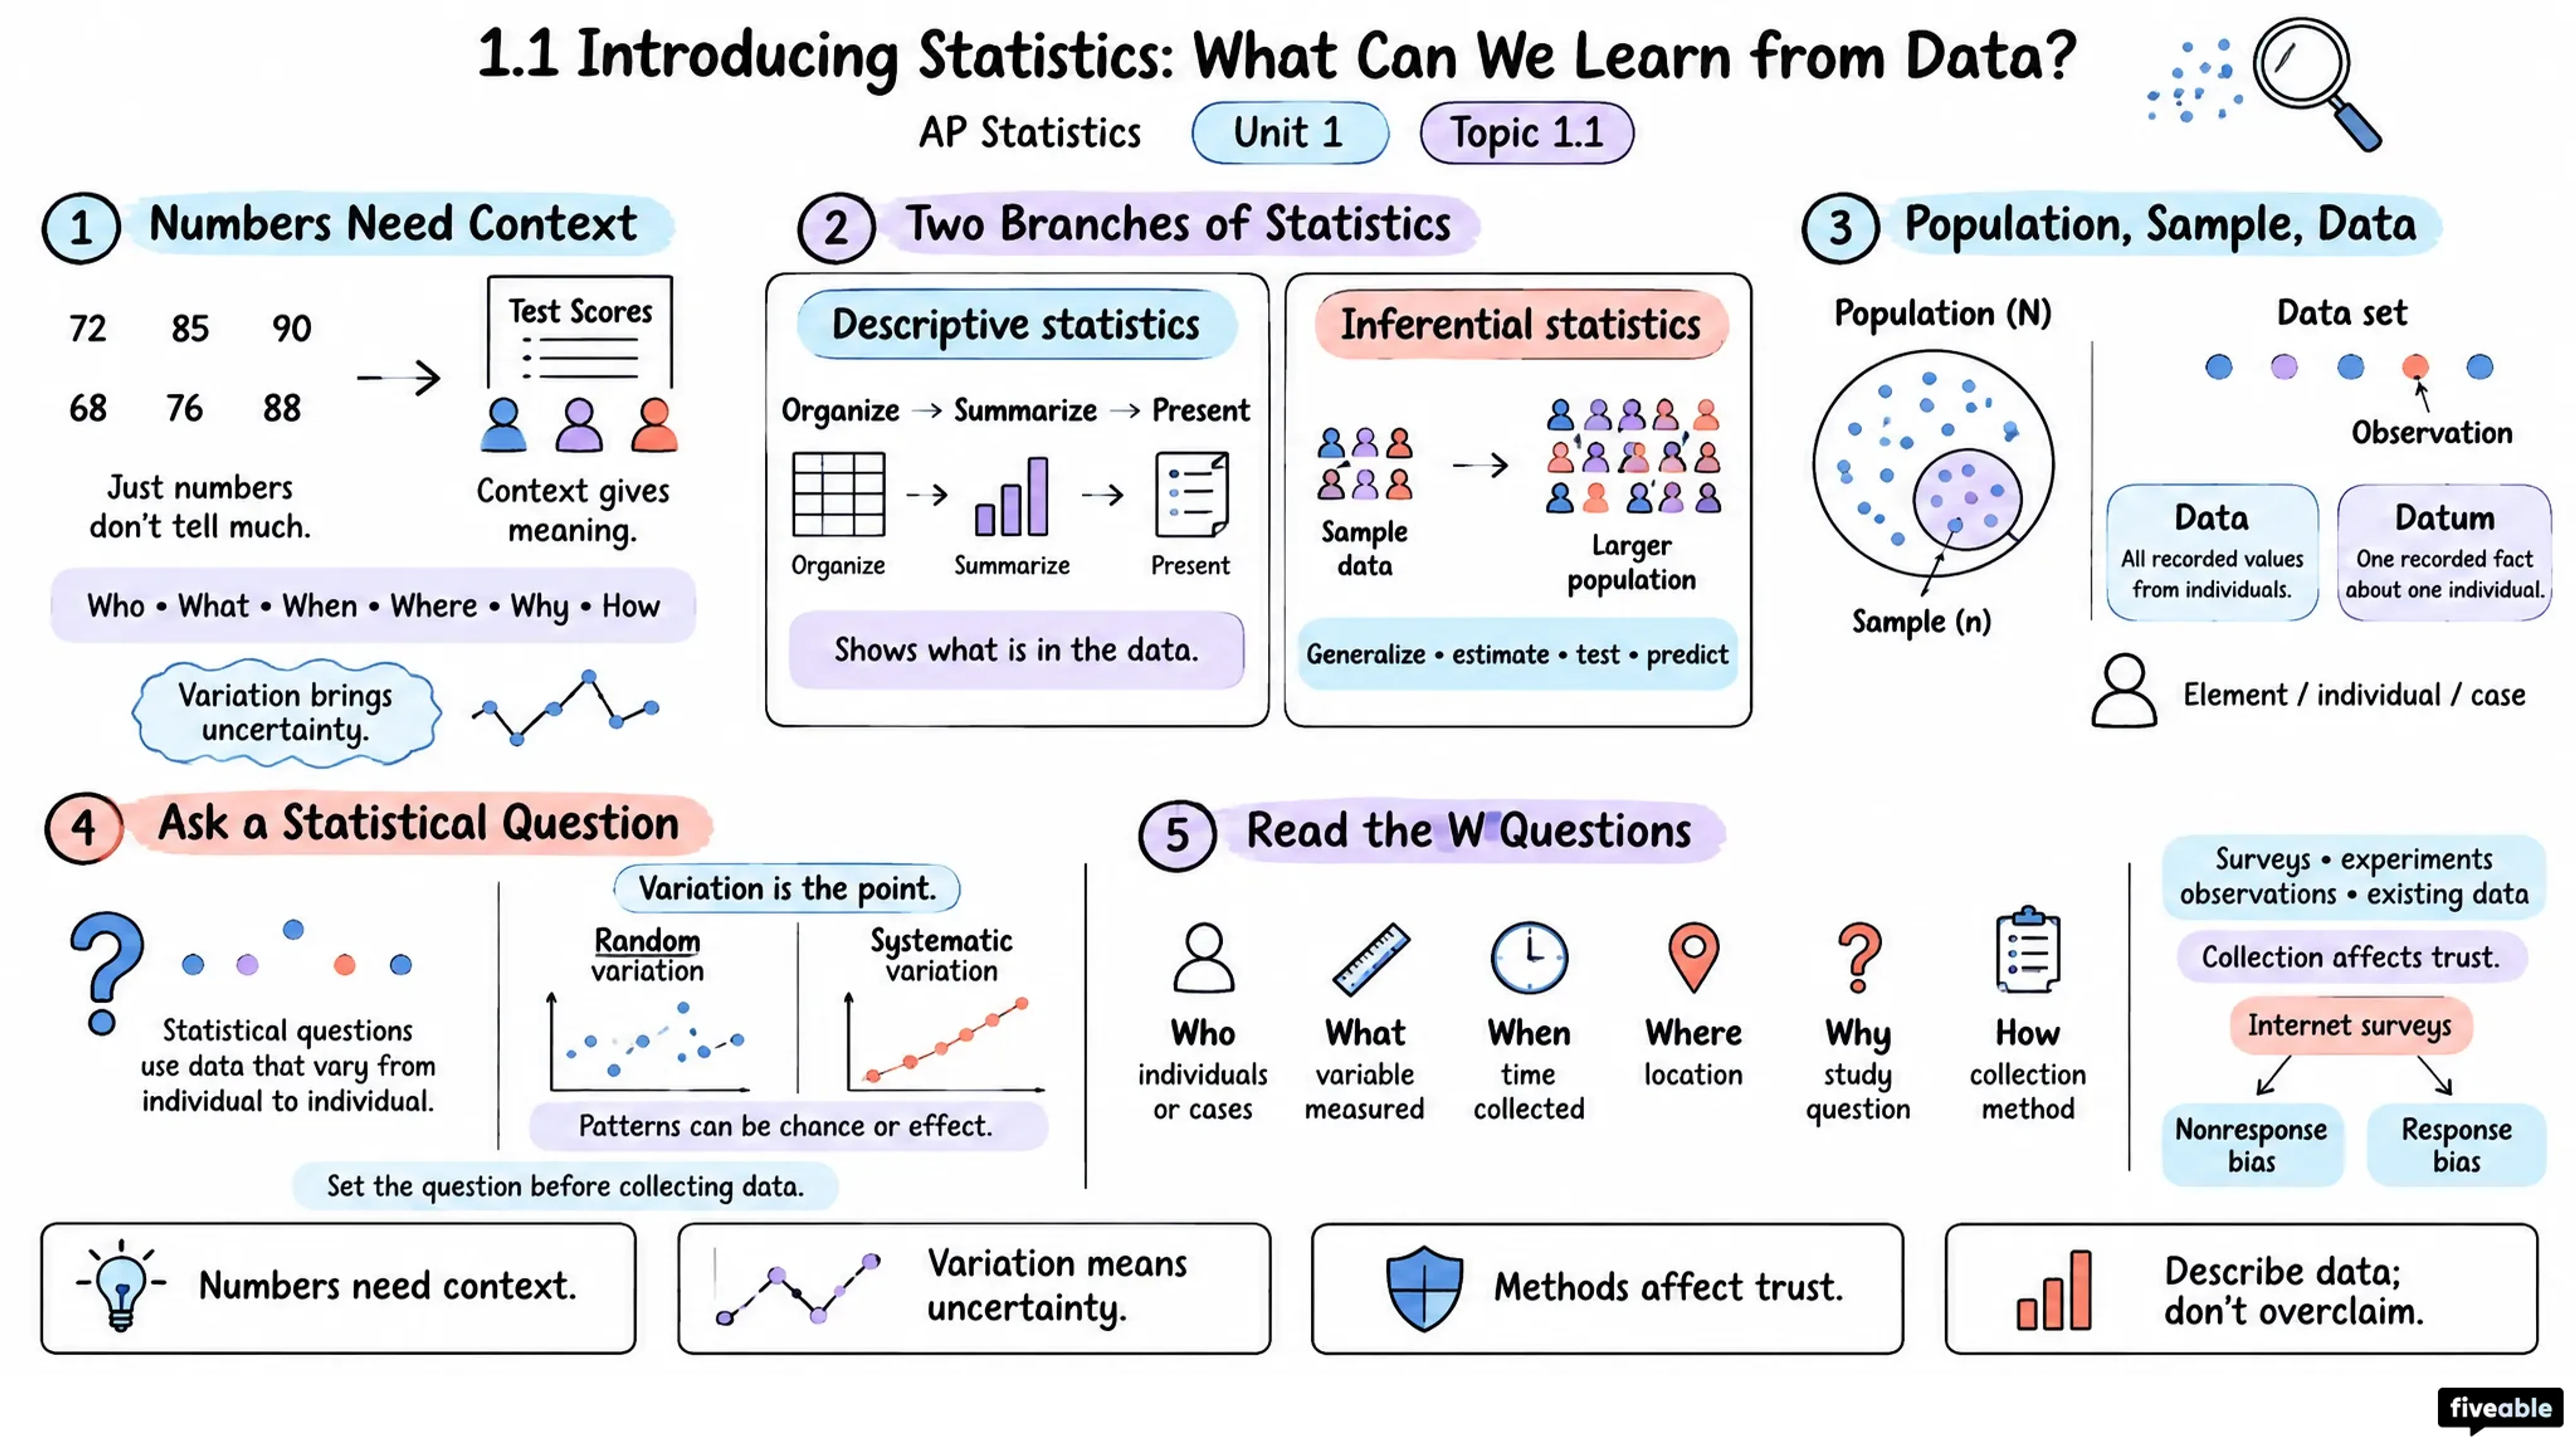
  • Population (N): All items/individuals of interest
  • Sample (n): Subset selected from population for study
  • Observational unit (individual): Single person or object on which one or more variables are measured
  • Datum: Single piece of information; data = collection

Key Principle: Studies necessary when population too large or difficult to access completely.

In Context: Always connect statistical results back to real-world meaning.
Center, Position & Variability

Measures of Center

  • Mean (x̄): x̄ = (1/n) Σ xᵢ; affected by outliers
  • Median: Middle value when ordered; resistant to outliers

Quartiles & Percentiles

  • Q1 (25th): Median of lower half
  • Q2 (50th): Median of all data
  • Q3 (75th): Median of upper half
  • pth percentile: p% of data ≤ this value

Variability

  • Range: Max − Min
  • IQR: Q3 − Q1 (middle 50%)
  • Std Dev (s): s = √[ (1/(n−1)) Σ (xᵢ − x̄)² ]

Outlier Detection

  • > Q3 + 1.5(IQR) or < Q1 − 1.5(IQR)
  • Values with |z| > 2 (i.e., > mean + 2s or < mean − 2s) are unusual/far from typical, but the AP outlier rule is the 1.5 × IQR rule: below Q1 − 1.5(IQR) or above Q3 + 1.5(IQR)

Random Sampling & Bias

Sampling Methods

  • Simple Random Sample (SRS): Every sample of size n has equal chance
  • Stratified: Divide into homogeneous strata; randomly sample within each
  • Cluster: Divide into clusters; randomly select clusters; collect from all units in selected clusters
  • Systematic: Select every kth unit from random starting point
  • With/without replacement: Unit returned or not after selection

Bias Types

  • Voluntary response: Sample of volunteers only
  • Undercoverage: Method excludes part of population
  • Nonresponse: Failure to obtain responses from selected individuals
  • Response: Responses differ from true value (confusing/leading questions, self-report)

Reducing Bias: Use random sampling; ensure high response rates; ask clear, neutral questions.

The rest of the Unit 1 sheet

6 more sections are on the one-page PDF:

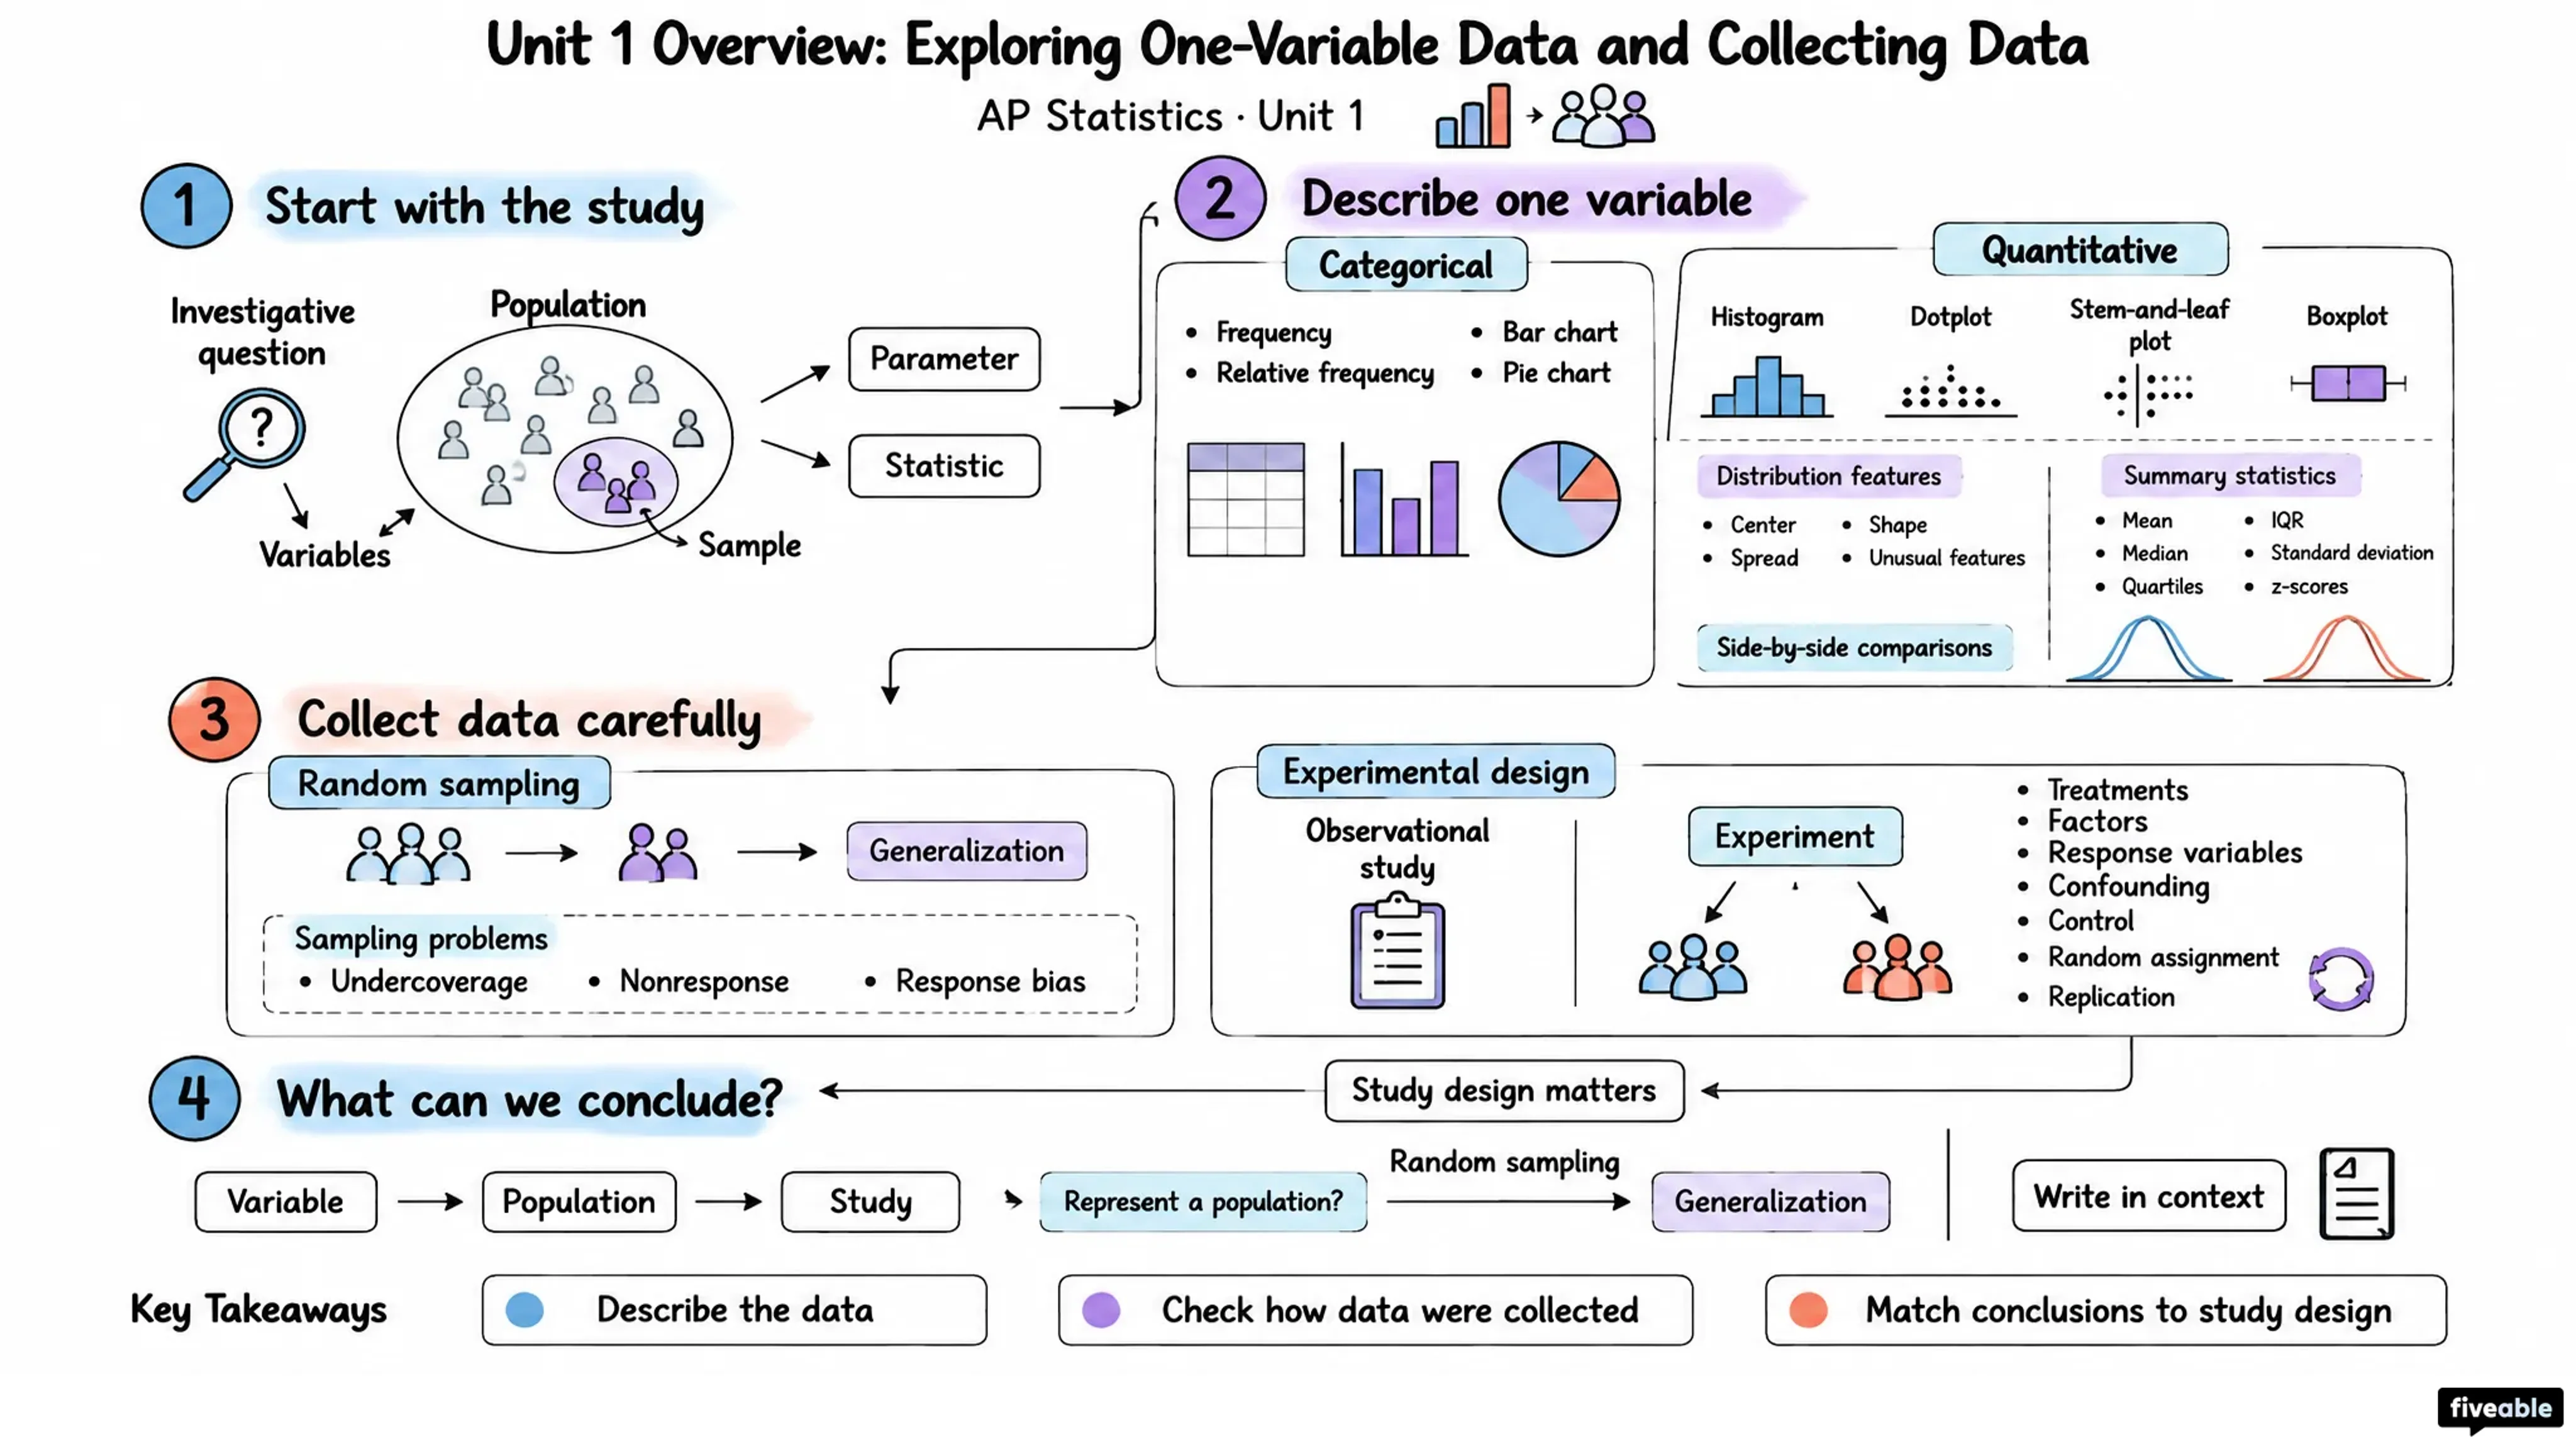
  • Variables: Types & Roles

  • Distribution Shape & Features

  • Experimental Design & Generalization

  • Categorical & Quantitative Displays

  • Z-Scores & Boxplots

  • Data Collection: Study Types

Made by Fiveable

Text-Based Cheatsheet

Unit 1: Exploring One-Variable Data and Collecting Data on one page, aligned to the 2026-2027 course. Made and checked by the Fiveable Content Team.

Or get the whole course

Made by you

Visual Cheatsheets

Pick a Unit 1 topic and a format: flowchart, comparison chart, vocab sheet, Cornell notes and more. Ready in about a minute.

Printable PDF · from the Fiveable shop

AP Statistics Unit 1 Cheatsheet

1 page · Exploring One-Variable Data and Collecting Data · PDF

Visual Cheatsheets

One topic, the format you pick, ready in about a minute

Format

Topic

Takes 30–60 seconds

Preview: Standard

Unit 1: Exploring One–Variable Data and Collecting Data, topic by topic

Each topic has a full study guide. See the whole unit.