🔺Trigonometry Unit 4 Review
4.2 Amplitude and Period
4.2 Amplitude and Period
Unit & Topic Study Guides
Trigonometric Functions
Acute Angles and Right Triangles
Radian Measure and the Unit Circle
Graphs of Sine and Cosine Functions
Graphs of Other Trigonometric Functions
Inverse Trigonometric Functions
Trigonometric Identities
Solving Trigonometric Equations
The Laws of Sines and Cosines
Polar Coordinates and Complex Numbers
Vectors and Applications
Amplitude and period are key features of trigonometric functions. Amplitude measures the height of waves, while period shows how often they repeat. These concepts help us understand everything from ocean waves to heartbeats.
In trig functions, amplitude is determined by |A|, and period by 2π/|B|. Changing these values affects the graph's shape. Bigger amplitude makes taller waves, while longer periods stretch the pattern horizontally.
Understanding Amplitude and Period in Trigonometric Functions
Amplitude and period definitions
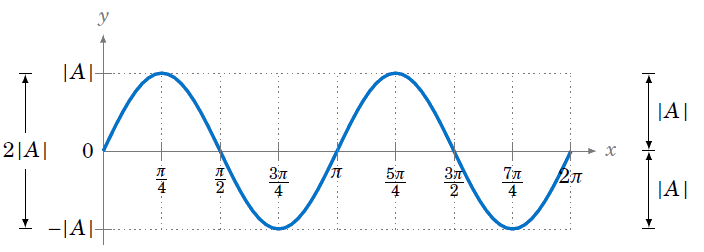
- Amplitude measures max vertical distance from midline to peak/trough, half the distance between max and min values (waves in ocean)
- Period represents horizontal distance for one complete cycle, length of full wave pattern repetition (heartbeat rhythm)
Identifying function characteristics
- General form: or
- Amplitude calculated as , absolute value of coefficient (sound wave intensity)
- Period determined by , using value in equation (Earth's rotation)

Effects of parameter changes
- Amplitude alterations stretch/compress graph vertically without affecting horizontal aspects
- Larger increases peak height and trough depth
- Smaller decreases peak height and trough depth
- Period modifications stretch/compress graph horizontally without impacting vertical aspects
- Longer period (smaller ) stretches graph horizontally
- Shorter period (larger ) compresses graph horizontally
Graphing with varied parameters
- Identify amplitude and period from equation
- Draw midline ( if present)
- Plot key points: y-intercept, max, and min
- Sketch curve through plotted points
- Sine functions start at midline and rise
- Cosine functions begin at max or min
- One cycle completes over one period
- Amplitude dictates distance from midline to peak/trough (radio waves, tidal patterns)