📰Intro to Journalism Unit 12 Review
12.2 Data journalism and analysis
12.2 Data journalism and analysis
Unit & Topic Study Guides
Journalism's Role in Society
Journalism Ethics: Core Principles
News Values and Newsworthiness
Journalism Law and Ethics
News Gathering and Interview Techniques
Evaluating Sources & Fact-Checking
News Writing Fundamentals
Story Structure and Organization
Reporting for Print Media
Broadcast Journalism Basics
Digital Journalism & Multimedia Storytelling
Investigative Reporting Techniques
Specialized Reporting: Politics & Business
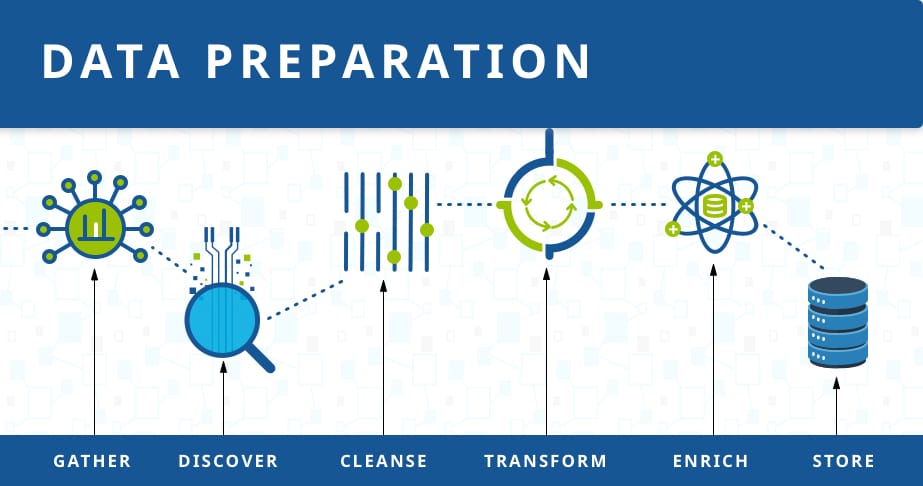
Data Acquisition and Preparation
Data journalism turns raw numbers into stories. Instead of relying only on interviews and documents, you use datasets to find patterns, verify claims, and uncover things that would be invisible otherwise. This section covers how to find data, clean it up, analyze it, weave it into a story, and handle it ethically.
Dataset Acquisition and Preparation
Before you can analyze anything, you need to find the right data and make sure it's trustworthy.
Where to find data:
- Government databases and public records are often your best starting point. The Census Bureau, EPA, Bureau of Labor Statistics, and local government sites publish enormous amounts of data that's free to access.
- Academic and research institutions produce peer-reviewed datasets on everything from public health to economics.
- Non-profit organizations and think tanks like Pew Research Center or the Brookings Institution publish data with analysis already attached, which can help you spot story angles.
- Corporate filings and industry reports, such as SEC filings and annual reports, are useful for business and financial investigations.
Evaluating data quality:
Not all data is created equal. Before you build a story around a dataset, ask these questions:
- Who collected this data, and how? A survey of 200 people and a survey of 20,000 people tell very different stories.
- Is the data complete, or are there gaps? Missing entries can skew your conclusions.
- Are there built-in biases? For example, crime data reflects what gets reported to police, not necessarily what happens.
How to acquire data:
- Submit FOIA requests. The Freedom of Information Act lets you request records from federal agencies. Most states have their own versions for state and local records. These requests can take weeks or months, so plan ahead.
- Download from public repositories. Sites like Data.gov and Kaggle host thousands of ready-to-use datasets.
- Use APIs. Many organizations offer application programming interfaces (APIs) that let you pull data directly into a spreadsheet or program.
- Scrape websites. When data is published on a webpage but not available for download, tools in Python or R can extract it automatically. Be aware that some sites prohibit scraping in their terms of service.
Cleaning and preprocessing:
Raw data is almost never ready for analysis. Cleaning it up is tedious but essential.
- Handle missing values by deciding whether to exclude incomplete records or fill in gaps using reasonable methods.
- Fix inconsistencies, like the same city spelled three different ways, or dates in different formats.
- Standardize variable names and data types so everything lines up when you merge datasets from different sources.
- Watch for outliers that might be errors (a person listed as 900 years old) versus outliers that are genuinely newsworthy.
Statistical Analysis for Insights
Once your data is clean, you can start looking for the story hidden inside it.
Exploratory data analysis is where you get familiar with what you have:
- Calculate descriptive statistics like mean, median, and standard deviation to understand the basic shape of your data. For example, if you're looking at teacher salaries across a state, the median might tell a more honest story than the mean if a few superintendents pull the average up.
- Look for patterns, trends, and anomalies. A sudden spike or drop in the data often points to something worth investigating.
- Run correlation analysis to see if two variables move together. If school funding goes up in districts where test scores also go up, that's a relationship worth exploring.
- Use hypothesis testing to check whether a pattern is statistically meaningful or could just be random chance.
A critical distinction: correlation does not equal causation. Two things can move together without one causing the other. Always look for alternative explanations.
Data visualization techniques make your findings understandable at a glance:
- Bar charts and line graphs work best for comparing categories or showing change over time.
- Scatterplots reveal relationships between two variables, like income vs. life expectancy.
- Choropleth maps (those color-shaded maps) display geographic patterns, such as poverty rates by county.
Tools like Tableau, Datawrapper, and Google Sheets are accessible for beginners. More advanced options include D3.js for interactive web graphics and ggplot2 in R.
Advanced methods go beyond what most intro-level projects require, but they're worth knowing about:
- Network analysis maps connections between people, organizations, or financial transactions, which is especially useful for corruption investigations.
- Text mining can analyze large volumes of unstructured text, like thousands of social media posts or court documents, to find patterns a human couldn't spot manually.

Integration of Data in Narratives
Finding an interesting pattern is only half the job. You still need to turn it into a story people will read.
Identify what's newsworthy:
- Focus on the findings that are most significant, surprising, or relevant to your audience. Not every number deserves a paragraph.
- Contextualize your data. A city spending $5 million on something means nothing until you compare it to what peer cities spend, or to what that city spent five years ago.
- Use data as evidence to support your reporting, not as a replacement for it. The strongest data stories combine numbers with human sources who can explain what those numbers mean on the ground.
Develop data-driven story angles:
- Data can reveal stories no one is telling yet. A database of health inspections might show that violations cluster in low-income neighborhoods. That's a lead.
- Let the data point you toward sources. If one school district is an outlier, call that superintendent and ask why.
- Stay open to where the data leads, even if it contradicts your initial hypothesis.
Present data visually within your story:
- Choose the simplest visualization that makes your point. A bar chart often beats a fancy interactive graphic.
- Write clear labels, captions, and explanations so readers who skip the chart still get the takeaway.
- For general audiences, explain what the visualization shows in plain language. Don't assume readers know how to interpret a scatterplot.
Ethics of Sensitive Data Handling
Working with data carries real responsibilities, especially when that data involves people.
Protecting privacy:
- Anonymize or aggregate data to prevent identifying individuals. Instead of publishing a list of patients, report totals by zip code or age group.
- Get informed consent when you collect personal information directly from people.
- Store sensitive data securely. Use encryption, strong passwords, and limit who has access. A leaked dataset can cause real harm.
Ensuring accuracy and transparency:
- Verify your sources and methods. If you scraped data from a website, confirm it matches the original.
- Disclose limitations in your reporting. If the dataset only covers three years, say so. If certain populations are underrepresented, acknowledge it.
- When possible, publish your raw data and methodology so others can check your work. This builds trust and is increasingly standard practice in data journalism.
Avoiding misrepresentation:
- Don't cherry-pick data points that support a predetermined conclusion while ignoring ones that don't.
- Clearly distinguish between correlation and causation. Saying "cities with more ice cream shops have higher crime rates" implies a connection that doesn't exist (both correlate with population size).
- Acknowledge when the evidence is mixed or when alternative explanations exist.
Legal and ethical standards:
- Be aware of data protection laws like GDPR (which governs personal data in the EU) and HIPAA (which protects health information in the U.S.). Violating these can have legal consequences.
- Respect intellectual property rights and any usage agreements attached to datasets you access.
- Maintain independence. If a dataset comes from an organization with a stake in the outcome, treat it with extra scrutiny.