Total Quality Management (TQM) is a comprehensive approach to improving quality and customer satisfaction across an organization. It emphasizes continuous improvement, employee involvement, and data-driven decision-making to enhance overall performance and competitiveness.
TQM integrates various tools and techniques, such as statistical process control, quality circles, and benchmarking. By focusing on customer needs, process management, and leadership commitment, TQM aims to create a culture of quality that permeates every aspect of an organization's operations.
Fundamentals of TQM
- Total Quality Management (TQM) represents a comprehensive approach to quality improvement in production and operations management
- TQM emphasizes organization-wide commitment to quality, customer satisfaction, and continuous improvement
- Integrates quality control principles with strategic management to enhance overall organizational performance
Definition and principles
- Holistic management philosophy focused on long-term success through customer satisfaction
- Core principles include customer focus, continuous improvement, and total employee involvement
- Emphasizes prevention of defects rather than inspection and correction after production
- Aims to create a quality culture throughout the organization, from top management to front-line workers
Historical development
- Evolved from statistical quality control methods developed in the 1920s and 1930s
- Gained prominence in Japan post-World War II, led by American quality experts (W. Edwards Deming, Joseph Juran)
- Adopted by U.S. companies in the 1980s in response to Japanese manufacturing success
- Expanded beyond manufacturing to service industries and public sector organizations
Key TQM theorists
- W. Edwards Deming introduced the 14 Points for Management and the Plan-Do-Check-Act cycle
- Joseph Juran developed the Quality Trilogy (quality planning, quality control, quality improvement)
- Philip Crosby promoted the concept of "zero defects" and quality as conformance to requirements
- Kaoru Ishikawa contributed the cause-and-effect diagram (fishbone diagram) and quality circles concept
Customer focus
- Customer focus forms the foundation of TQM, prioritizing customer needs and expectations in all organizational processes
- Emphasizes the importance of understanding and meeting both stated and implied customer requirements
- Aligns production and operations management strategies with customer satisfaction goals
Voice of the customer
- Systematic approach to capture, analyze, and interpret customer needs and preferences
- Utilizes various data collection methods (surveys, focus groups, customer interviews)
- Translates customer requirements into specific product or service features and quality standards
- Informs product design, process improvements, and strategic decision-making
Customer satisfaction metrics
- Net Promoter Score (NPS) measures customer loyalty and likelihood to recommend
- Customer Satisfaction Score (CSAT) assesses overall satisfaction with a product or service
- Customer Effort Score (CES) evaluates ease of customer interactions with the company
- Churn rate tracks customer retention and identifies areas for improvement
Internal vs external customers
- External customers purchase final products or services
- Internal customers receive outputs from other departments within the organization
- Recognizing and satisfying internal customer needs improves overall organizational efficiency
- Treating employees as internal customers fosters a quality-focused culture throughout the company
Continuous improvement
- Continuous improvement represents an ongoing effort to enhance products, services, and processes
- Integral to TQM philosophy, emphasizing that quality can always be improved
- Drives innovation and adaptability in production and operations management
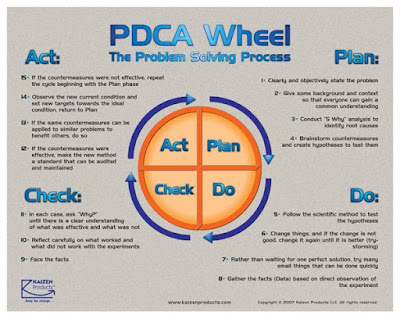
PDCA cycle
- Plan-Do-Check-Act cycle provides a structured approach to problem-solving and improvement
- Plan phase identifies problems and develops potential solutions
- Do phase implements the chosen solution on a small scale
- Check phase evaluates the results and effectiveness of the solution
- Act phase standardizes successful improvements and initiates the next cycle
Kaizen philosophy
- Japanese concept meaning "change for the better" or continuous improvement
- Emphasizes small, incremental improvements made by all employees
- Focuses on eliminating waste (muda) in all forms (time, resources, effort)
- Encourages employee involvement and empowerment in improvement initiatives
Six Sigma methodology
- Data-driven approach to process improvement aimed at reducing defects and variability
- Utilizes DMAIC framework (Define, Measure, Analyze, Improve, Control)
- Employs statistical tools to identify and eliminate sources of variation
- Aims for 3.4 defects per million opportunities, representing near-perfect quality
Employee involvement
- Employee involvement is a crucial aspect of TQM, recognizing that quality is everyone's responsibility
- Emphasizes the importance of engaging all employees in quality improvement efforts
- Aligns with production and operations management goals of efficiency and effectiveness
Quality circles
- Small groups of employees who meet regularly to discuss and solve work-related problems
- Typically composed of 5-12 members from the same work area
- Encourage employee participation in problem-solving and decision-making processes
- Foster a sense of ownership and commitment to quality improvement
Cross-functional teams
- Groups composed of members from different departments or functional areas
- Bring diverse perspectives and expertise to problem-solving and improvement initiatives
- Enhance communication and collaboration across organizational boundaries
- Facilitate holistic approaches to quality management and process improvement

Empowerment and training
- Empowerment involves delegating authority and responsibility to employees at all levels
- Training programs equip employees with necessary skills and knowledge for quality improvement
- Includes technical skills, problem-solving techniques, and quality management principles
- Continuous learning culture supports ongoing improvement and adaptation to changing requirements
Process management
- Process management focuses on designing, monitoring, and improving organizational processes
- Emphasizes the interconnectedness of processes across the organization
- Aligns with production and operations management goals of efficiency and effectiveness
Process mapping
- Visual representation of workflow and activities within a process
- Identifies inputs, outputs, decision points, and relationships between process steps
- Helps identify inefficiencies, bottlenecks, and opportunities for improvement
- Facilitates standardization and documentation of best practices
Statistical process control
- Uses statistical methods to monitor and control process variability
- Control charts track process performance over time and identify special cause variations
- Process capability analysis assesses a process's ability to meet specifications
- Provides early warning of potential quality issues, enabling proactive interventions
Root cause analysis
- Systematic approach to identifying the underlying causes of problems or defects
- Utilizes tools like the "5 Whys" technique and fishbone diagrams
- Focuses on addressing root causes rather than symptoms to prevent recurrence
- Promotes a culture of problem-solving and continuous improvement
Quality tools and techniques
- Quality tools and techniques provide structured approaches to problem-solving and improvement
- Essential for implementing TQM principles in production and operations management
- Enable data-driven decision-making and systematic quality improvement efforts
Seven basic quality tools
- Cause-and-effect diagram (Ishikawa or fishbone diagram) identifies potential causes of problems
- Check sheet organizes data collection for further analysis
- Control charts monitor process stability and identify variations
- Histogram visualizes frequency distribution of data
- Pareto chart prioritizes issues based on the 80/20 principle
- Scatter diagram examines relationships between variables
- Stratification separates data into meaningful categories for analysis
Advanced quality tools
- Affinity diagram organizes large amounts of qualitative data into logical groups
- Relations diagram identifies complex cause-and-effect relationships
- Tree diagram breaks down broad categories into more detailed levels
- Matrix diagram shows relationships between two or more sets of factors
- Arrow diagram (activity network diagram) plans and schedules complex projects
- Process decision program chart (PDPC) anticipates potential problems in a plan
Benchmarking
- Systematic process of comparing organizational performance against industry leaders
- Identifies best practices and performance gaps
- Types include internal, competitive, functional, and generic benchmarking
- Drives continuous improvement by setting stretch goals based on industry standards
Leadership in TQM
- Leadership plays a crucial role in successful TQM implementation and sustainability
- Emphasizes the importance of top management commitment to quality initiatives
- Aligns with production and operations management strategies for organizational excellence
Management commitment
- Visible and active support from top management for TQM initiatives
- Allocation of necessary resources (time, budget, personnel) for quality improvement
- Leading by example in prioritizing quality and customer satisfaction
- Regular communication of quality goals and achievements throughout the organization
Quality culture
- Shared values, beliefs, and behaviors that prioritize quality throughout the organization
- Encourages open communication, trust, and collaboration among employees
- Promotes a mindset of continuous improvement and learning
- Recognizes and rewards quality-focused behaviors and achievements
Vision and strategy alignment
- Integrating quality objectives into the organization's overall vision and mission
- Developing strategic plans that incorporate TQM principles and goals
- Cascading quality objectives throughout all levels of the organization
- Ensuring consistency between quality initiatives and other organizational strategies
TQM implementation
- TQM implementation requires a systematic approach and organization-wide commitment
- Emphasizes the importance of careful planning and execution of quality initiatives
- Aligns with production and operations management goals of improving overall organizational performance
Organizational readiness
- Assessment of current quality management practices and organizational culture
- Identification of gaps between current state and desired TQM implementation
- Evaluation of leadership commitment and employee readiness for change
- Development of a comprehensive implementation plan tailored to the organization's needs
Implementation challenges
- Resistance to change from employees and management
- Lack of understanding or commitment to TQM principles
- Insufficient resources or time allocated for implementation
- Difficulty in measuring and demonstrating short-term results
- Maintaining momentum and sustaining improvements over time
Success factors
- Strong leadership commitment and visible support from top management
- Clear communication of TQM goals, benefits, and expectations to all employees
- Comprehensive training programs to develop necessary skills and knowledge
- Integration of TQM principles into existing organizational systems and processes
- Regular monitoring, evaluation, and adjustment of implementation efforts
Measuring TQM effectiveness
- Measuring TQM effectiveness is crucial for assessing progress and driving continuous improvement
- Emphasizes the importance of data-driven decision-making in quality management
- Aligns with production and operations management goals of performance evaluation and optimization
Key performance indicators
- Customer satisfaction metrics (Net Promoter Score, Customer Satisfaction Index)
- Process quality measures (defect rates, cycle time, on-time delivery)
- Employee engagement and satisfaction scores
- Financial performance indicators (revenue growth, cost savings, return on investment)
- Operational efficiency metrics (productivity, resource utilization)
Quality awards and recognition
- Malcolm Baldrige National Quality Award (MBNQA) in the United States
- European Foundation for Quality Management (EFQM) Excellence Award
- Deming Prize in Japan
- ISO 9001 certification for quality management systems
- Industry-specific quality awards and certifications
Cost of quality
- Prevention costs associated with proactive quality measures (training, process improvement)
- Appraisal costs related to inspections and quality control activities
- Internal failure costs from defects caught before reaching customers (rework, scrap)
- External failure costs resulting from quality issues after product delivery (returns, warranty claims)
- Analysis of cost of quality trends to assess TQM effectiveness and identify improvement opportunities
TQM vs other quality approaches
- Comparison of TQM with other quality management approaches helps understand their unique features and applications
- Emphasizes the importance of selecting appropriate quality methodologies for specific organizational needs
- Aligns with production and operations management strategies for continuous improvement and optimization
ISO 9000 standards
- Family of international standards for quality management systems
- Focuses on documenting processes and ensuring consistency in quality management
- Provides a framework for implementing and maintaining quality management systems
- Certification demonstrates compliance with internationally recognized quality standards
- Complements TQM by providing a structured approach to quality management
Lean manufacturing
- Focuses on eliminating waste and maximizing value from the customer's perspective
- Emphasizes continuous flow, pull systems, and just-in-time production
- Utilizes tools like value stream mapping and 5S for process improvement
- Shares TQM's focus on continuous improvement and employee involvement
- Can be integrated with TQM to enhance overall quality and efficiency
Agile methodologies
- Iterative and incremental approach to project management and product development
- Emphasizes flexibility, collaboration, and rapid response to change
- Utilizes short development cycles (sprints) and frequent customer feedback
- Shares TQM's customer focus and continuous improvement principles
- Can complement TQM in dynamic and fast-paced environments
Future of TQM
- The future of TQM involves adapting to emerging technologies and global challenges
- Emphasizes the importance of continuous evolution in quality management practices
- Aligns with production and operations management strategies for long-term competitiveness and sustainability
Integration with technology
- Incorporation of artificial intelligence and machine learning for predictive quality management
- Use of big data analytics to identify patterns and trends in quality data
- Implementation of Internet of Things (IoT) devices for real-time quality monitoring
- Adoption of blockchain technology for enhanced traceability and transparency in supply chains
- Virtual and augmented reality applications for quality training and process visualization
Global quality management
- Harmonization of quality standards across international markets and supply chains
- Addressing cultural differences in quality perceptions and practices
- Managing quality in increasingly complex and distributed global operations
- Developing global quality management systems that balance standardization and local adaptation
- Collaboration with international partners on quality improvement initiatives
Emerging trends
- Integration of sustainability and social responsibility into quality management practices
- Focus on customer experience management beyond traditional product quality
- Emphasis on agility and resilience in quality management systems
- Incorporation of cybersecurity and data privacy considerations into quality management
- Development of quality management approaches for digital products and services