Regression analysis is a powerful statistical tool used in operations management to understand relationships between variables and make data-driven decisions. It helps managers predict outcomes, optimize processes, and identify key factors influencing production efficiency.
This technique allows for modeling relationships between dependent and independent variables, enabling prediction of future outcomes based on historical data. Various types of regression models, including linear and non-linear, are used to capture different relationships in operational contexts.
Fundamentals of regression analysis
- Regression analysis forms a crucial component of quantitative methods in Production and Operations Management, enabling managers to understand relationships between variables and make data-driven decisions
- This statistical technique helps operations managers predict outcomes, optimize processes, and identify key factors influencing production efficiency
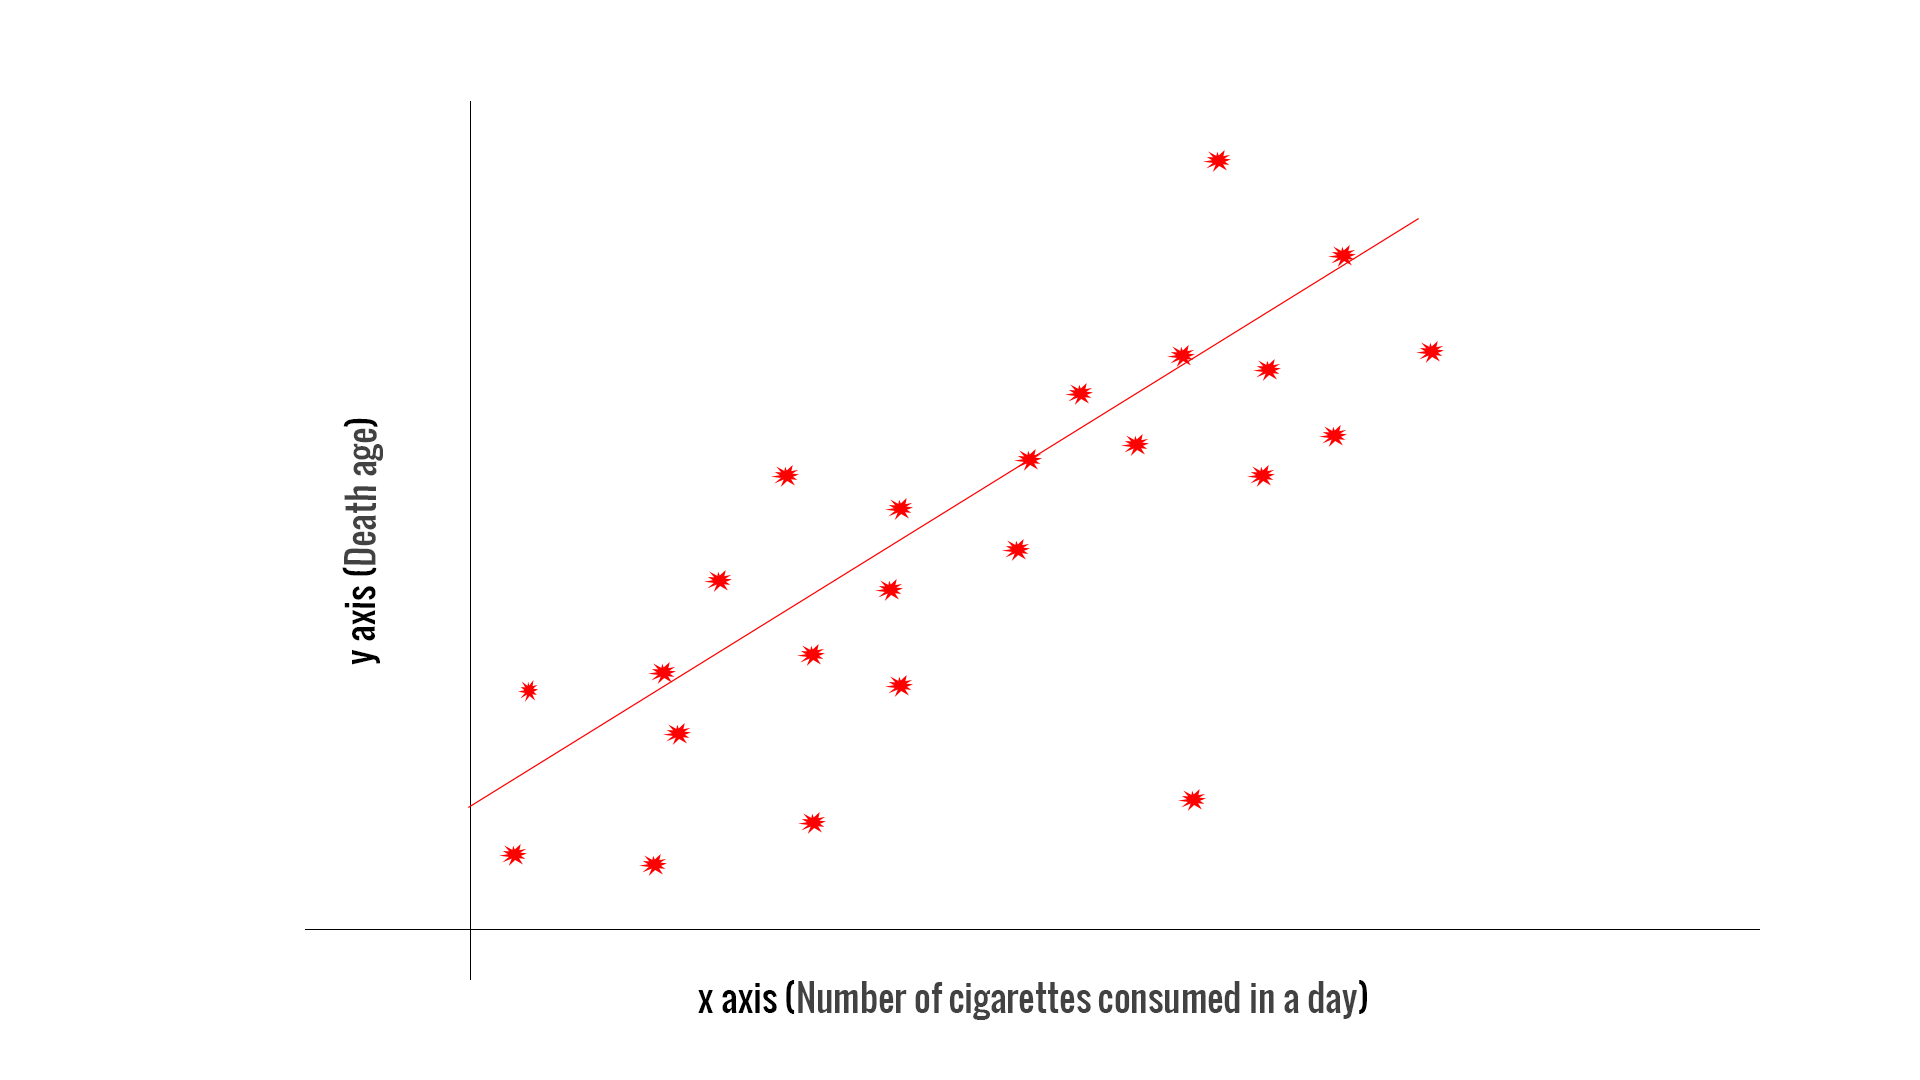
Definition and purpose
- Statistical method used to model the relationship between a dependent variable and one or more independent variables
- Aims to estimate the strength and direction of associations between variables
- Allows for prediction of future outcomes based on historical data patterns
- Helps identify which factors have the most significant impact on the outcome variable
Types of regression models
- Linear regression models assume a straight-line relationship between variables
- Non-linear regression models capture more complex relationships (exponential, logarithmic)
- Simple regression involves one independent variable, while multiple regression includes two or more
- Logistic regression predicts categorical outcomes, useful for binary decision-making in operations
Dependent vs independent variables
- Dependent variable (response variable) represents the outcome being predicted or explained
- Independent variables (predictor variables) are the factors used to predict the dependent variable
- In operations management, dependent variables might include production output or quality metrics
- Independent variables could encompass factors like raw material input, labor hours, or machine settings
Simple linear regression
- Simple linear regression serves as the foundation for more complex regression analyses in operations management
- This technique allows managers to understand how changes in one variable affect another, crucial for process improvement and resource allocation
Equation and components
- Represented by the formula:
- Y denotes the dependent variable (outcome)
- X represents the independent variable (predictor)
- β₀ is the y-intercept, indicating the value of Y when X is zero
- β₁ represents the slope, showing the change in Y for a one-unit increase in X
- ε symbolizes the error term, accounting for unexplained variation in the model
Least squares method
- Technique used to find the best-fitting line through a set of data points
- Minimizes the sum of squared differences between observed and predicted values
- Produces estimates for β₀ and β₁ that minimize the overall prediction error
- Provides a mathematical basis for determining the optimal regression line
Interpreting regression coefficients
- β₀ (y-intercept) represents the predicted value of Y when X equals zero
- β₁ (slope) indicates the average change in Y for a one-unit increase in X
- Positive slope suggests a direct relationship, negative slope an inverse relationship
- Statistical significance of coefficients determined through hypothesis testing (t-tests)
Multiple linear regression
- Multiple linear regression extends simple regression to include multiple independent variables
- This technique is vital in operations management for analyzing complex systems with multiple influencing factors
Model specification
- General form:
- Includes k independent variables (X₁, X₂, ..., Xₖ) with corresponding coefficients (β₁, β₂, ..., βₖ)
- Allows for simultaneous analysis of multiple factors affecting the dependent variable
- Requires careful selection of relevant independent variables based on domain knowledge and statistical criteria
Assumptions and limitations
- Linearity assumption requires a linear relationship between dependent and independent variables
- Independence of errors assumes no autocorrelation in residuals
- Homoscedasticity assumes constant variance of residuals across all levels of independent variables
- Normality of residuals assumes errors are normally distributed
- No perfect multicollinearity among independent variables
Multicollinearity issues
- Occurs when independent variables are highly correlated with each other
- Can lead to unstable and unreliable coefficient estimates
- Detected using variance inflation factor (VIF) or correlation matrices
- Addressed through variable selection, principal component analysis, or ridge regression techniques
Regression diagnostics
- Regression diagnostics play a crucial role in validating the assumptions and reliability of regression models in operations management
- These techniques help identify potential issues that could lead to inaccurate predictions or misleading insights
Residual analysis
- Examines the differences between observed and predicted values (residuals)
- Plots residuals against predicted values to check for patterns or heteroscedasticity
- Normal probability plots assess the normality assumption of residuals
- Helps identify non-linear relationships or the need for variable transformations
Outliers and influential points
- Outliers are data points that deviate significantly from the overall pattern
- Influential points have a disproportionate impact on the regression results
- Detected using standardized residuals, leverage, or Cook's distance measures
- Requires careful consideration to determine whether to remove, transform, or retain these points
Goodness of fit measures
- R-squared (coefficient of determination) indicates the proportion of variance explained by the model
- Adjusted R-squared accounts for the number of predictors in the model
- F-statistic assesses the overall significance of the regression model
- Root Mean Square Error (RMSE) measures the average prediction error in the original units
Non-linear regression models
- Non-linear regression models capture complex relationships beyond simple straight-line patterns
- These models are essential in operations management for analyzing processes with non-linear behaviors or outcomes
Polynomial regression
- Extends linear regression by including polynomial terms (X², X³, etc.)
- Captures curvilinear relationships between variables
- Useful for modeling non-linear trends in production processes or demand patterns
- Requires careful selection of polynomial degree to avoid overfitting
Logistic regression
- Predicts the probability of a binary outcome (0 or 1)
- Uses a logistic function to model the relationship between variables
- Applicable in quality control for predicting pass/fail outcomes or in inventory management for stockout predictions
- Coefficients interpreted as odds ratios rather than direct effects
Time series regression
- Analyzes data collected over time to identify trends, seasonality, and cyclic patterns
- Incorporates lagged variables and time-based predictors
- Essential for demand forecasting and production planning in operations management
- Addresses autocorrelation issues common in time-ordered data
Applications in operations management
- Regression analysis finds widespread use in various aspects of operations management
- These applications help optimize processes, improve decision-making, and enhance overall operational efficiency
Demand forecasting
- Uses historical sales data to predict future demand for products or services
- Incorporates factors like seasonality, economic indicators, and marketing efforts
- Helps in inventory management, production planning, and resource allocation
- Enables businesses to optimize supply chain operations and reduce costs
Quality control
- Identifies factors influencing product quality and defect rates
- Analyzes the relationship between process parameters and quality outcomes
- Supports continuous improvement initiatives by pinpointing areas for enhancement
- Helps in setting optimal process control limits and predicting quality issues
![Definition and purpose, Lab 7. Statistical models. Linear regression [CS Open CourseWare]](https://storage.googleapis.com/static.prod.fiveable.me/search-images%2F%22Regression_analysis_definition_purpose_relationship_dependent_independent_variables_prediction_statistical_method_image%22-linear_regression.png%3Fw%3D600%26tok%3Dc48828.png)
Process optimization
- Determines the optimal settings for production processes to maximize efficiency
- Analyzes the impact of various inputs (labor, materials, equipment) on output metrics
- Supports decision-making in resource allocation and process design
- Enables managers to identify bottlenecks and areas for potential improvement
Model selection and validation
- Model selection and validation are critical steps in ensuring the reliability and applicability of regression models in operations management
- These techniques help identify the most appropriate model and assess its performance on new data
Stepwise regression
- Automated process for selecting the most relevant independent variables
- Forward selection adds variables one at a time based on statistical criteria
- Backward elimination starts with all variables and removes less significant ones
- Bidirectional elimination combines both approaches for optimal variable selection
- Helps simplify complex models and reduce overfitting
Cross-validation techniques
- Assesses how well the model generalizes to new, unseen data
- K-fold cross-validation divides data into k subsets for training and testing
- Leave-one-out cross-validation uses all but one data point for training
- Helps detect overfitting and provides a more robust estimate of model performance
- Essential for ensuring model reliability in real-world operations management applications
Model comparison criteria
- Akaike Information Criterion (AIC) balances model fit and complexity
- Bayesian Information Criterion (BIC) penalizes model complexity more heavily than AIC
- Adjusted R-squared compares models with different numbers of predictors
- Mean Absolute Error (MAE) and Root Mean Square Error (RMSE) assess prediction accuracy
- Helps select the most appropriate model for specific operations management tasks
Regression analysis software
- Various software tools are available for conducting regression analysis in operations management
- These tools range from specialized statistical packages to general-purpose programming languages
Statistical packages
- SPSS (Statistical Package for the Social Sciences) offers a user-friendly interface for regression analysis
- SAS (Statistical Analysis System) provides advanced analytics capabilities for large-scale data analysis
- Minitab focuses on quality improvement and statistical process control applications
- These packages offer built-in functions for model estimation, diagnostics, and visualization
Spreadsheet tools
- Microsoft Excel includes basic regression functionality through the Data Analysis ToolPak
- Google Sheets provides similar capabilities with the added benefit of cloud-based collaboration
- Spreadsheet tools are accessible for quick analyses and visualizations in operations management
- Limitations in handling large datasets or complex models compared to specialized software
Programming languages for regression
- R programming language offers extensive libraries for statistical analysis and modeling
- Python with libraries like scikit-learn and statsmodels provides flexible regression capabilities
- These languages allow for custom model development and integration with other data processing tasks
- Particularly useful for large-scale data analysis and automation of regression processes in operations
Limitations and alternatives
- Understanding the limitations of regression analysis is crucial for its appropriate application in operations management
- Alternative approaches can complement or replace regression in certain scenarios
Causation vs correlation
- Regression establishes correlation between variables but does not prove causation
- Experimental designs or causal inference techniques may be necessary to determine true causal relationships
- Managers must consider external factors and domain knowledge when interpreting regression results
- Caution required when using regression for predictive decision-making in complex operational environments
Machine learning approaches
- Neural networks can capture complex non-linear relationships in high-dimensional data
- Random forests and gradient boosting machines offer robust predictive models for operations
- Support vector machines excel in classification tasks relevant to quality control and process monitoring
- These techniques often outperform traditional regression in predictive accuracy but may sacrifice interpretability
Non-parametric regression methods
- Kernel regression estimates relationships without assuming a specific functional form
- Generalized additive models (GAMs) allow for flexible modeling of non-linear effects
- Decision trees provide intuitive, rule-based models for operational decision-making
- These methods offer alternatives when parametric assumptions of traditional regression are violated